The Azure Monitoring Extension for SAP on Windows – Possible Error Codes and Their Solutions
The Azure Enhanced Monitoring Extension for SAP provides configuration information and performance data of the underlying Azure infrastructure and makes it available to the SAP application. It contains built-in self-diagnostics which enables identification of the health and completeness of the infrastructure data required by SAP services and support.
For details on the setup and for possible health checks of the Azure Monitoring infrastructure, see SAP NetWeaver on Azure Virtual Machines – Deployment Guide and check SAP Note 1999351 for known issues. For a list of metrics provided in SAP transaction ST06, see SAP Note 2178632.
Having set up the Azure Enhanced Monitoring Extension for SAP, the Windows service AzureEnhancedMonitoring is installed inside the VM and collects all Azure-related data. Afterwards, this data is consumed by SAP Host Agent and by saposcol.exe for further use in the SAP system transaction ST06.
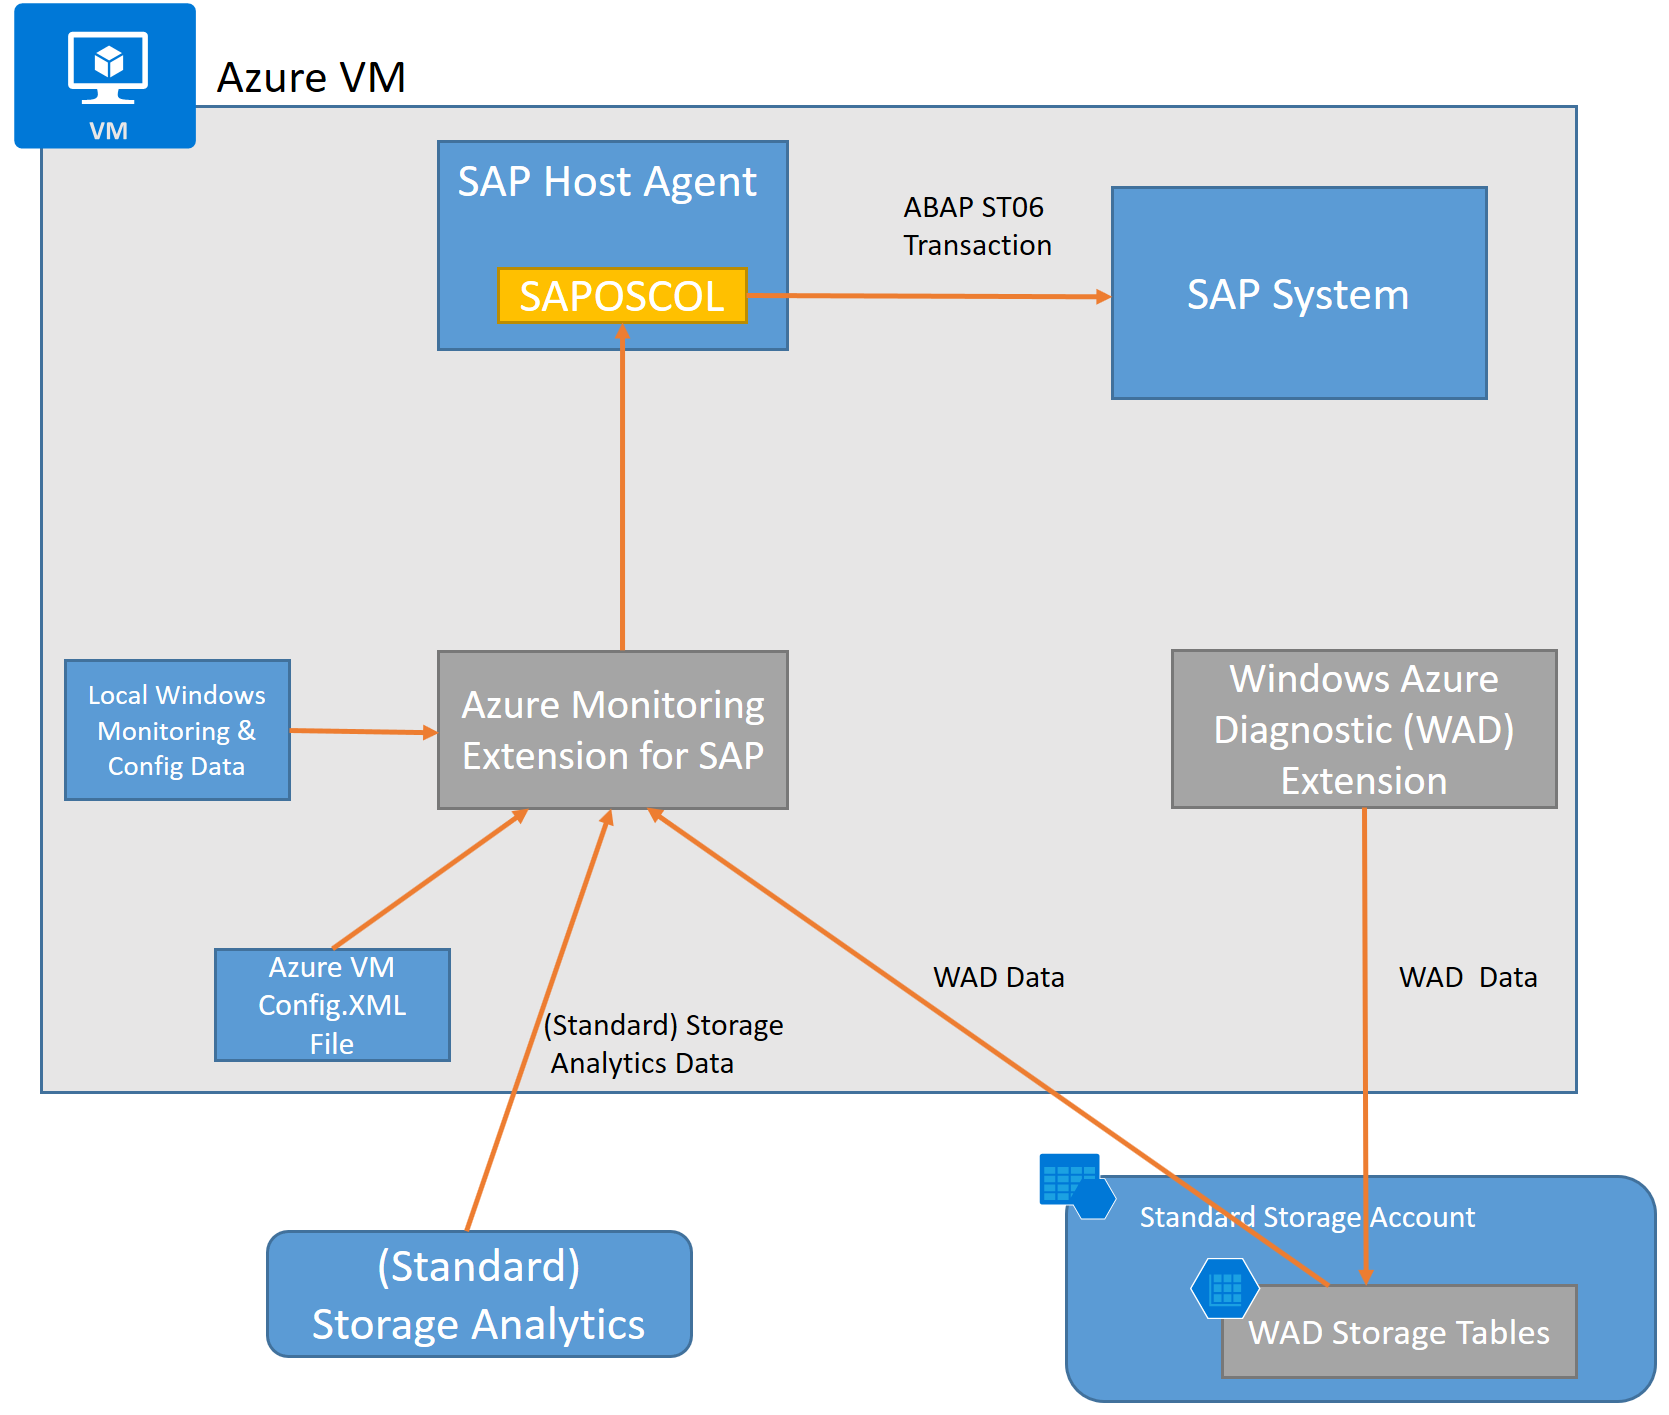
Picture: SAP Azure Monitoring Architecture
SAP Host Agent (e.g. saposcol.exe) and the SAP system consume data of the Azure Enhanced Monitoring service. The Azure Enhanced Enhanced Monitoring service is based on the Azure Monitoring Extension for SAP. The Azure Enhanced Monitoring Extension for SAP collects data from different sources:
- some local Windows performance and configuration data
- configuration data (config.xml file) stored during setup of the VM
- Azure storage analytics data (used if you use standard storage account for your SAP deployment)
- Windows Azure Diagnostics (WAD) data (by accessing the Azure storage account tables)
As both, the Azure Enhanced Monitoring service and the SAP monitoring are based on the underlying Azure Enhanced Monitoring Extension, issues in the setup of the extension directly lead to an unhealthy status of the Azure Monitoring service as well as of the SAP monitoring.
Identify the Health Status of the Azure Enhanced Monitoring
To check the health status of the Azure Enhanced Monitoring service, log on to the VM and proceed as follows:
Open the Windows services and select the service ‘AzureEnhancedMonitoring’.
Right-click on the service name and choose ‘Properties’. In the upcoming window, check for the field ‘Path to executable’ (this field points to the installation folder of the Azure Monitoring Extension). This path is similar to
‘C:\Packages\Plugins\Microsoft.AzureCAT.AzureEnhancedMonitoring.AzureCATExtensionHandler\<version>\drop’ , where version indicates the current version of the extension.Open a command prompt and switch to the installation folder indicated above.
In this folder, you can find the command line tool azperflib.exe which enables testing of the monitoring information provided by the Azure extension and its health status.Execute ‘azperflib.exe’.Note: Azperflib.exe runs in a loop and updates the collected counters every 60 seconds. In order to finish the loop, you need to close the command window.
Pay attention to the summary metrics ‘Health status’ and ‘Diagnostics’, which are shown at the end of each loop of azperflib.exe:Health status: OK
Diagnostics: OKThe Health status is either OK or Failed:
- If the Health status is ‘OK’, there is nothing more to do.
- If the Health status is ‘Failed’, the field ‘Diagnostics’ contains further details on the root causes of the health issues.Note: These root causes might be related to accessibility issues to WAD or to the storage accounts used, to misconfigurations or changes in configuration of the VM after execution of the setup script.
Use the Error IDs indicated in the ‘Diagnostics’ metric and follow up with their solutions provided in the table below.
Repeat steps 4 and 5 until azperflib.exe reports the ‘Health status’ ‘OK’.
As the health status of the SAP Monitoring is directly influenced by the health status of the Azure extension, a healthy status of the Azure Enhanced Monitoring is always reflected in a healthy status of the SAP monitoring.
Error Codes of the Azure Extension and Their Interpretation
Error ID |
Error description |
Solution |
cfg/018 |
App configuration is missing. |
|
cfg/019 |
No deployment ID in app config. |
|
cfg/020 |
No RoleInstanceId in app config. |
|
cfg/022 |
No RoleInstanceId in app config. |
|
cfg/031 |
Cannot read Azure configuration. |
|
cfg/021 |
App configuration file is missing. |
|
cfg/015 |
No VM size in app config. |
|
cfg/016 |
GlobalMemoryStatusEx counter failed. |
|
cfg/023 |
MaxHwFrequency counter failed. |
|
cfg/024 |
NIC counters failed. |
|
cfg/025 |
Disk mapping counter failed. |
|
cfg/026 |
Processor name counter failed. |
|
cfg/027 |
Disk mapping counter failed. |
|
cfg/038 |
The metric ‘Disk type’ is missing in the extension configuration file config.xml. ‘Disk type’ along with some other counters was introduced in v2.2.0.68 12/16/2015. If you deployed the extension prior to 12/16/2015, it uses the old configuration file. The Azure extension framework automatically upgrades the extension to a newer version, but the config.xml remains unchanged. To update the configuration, download and execute the latest PowerShell setup script. |
|
cfg/039 |
No disk caching. |
|
cfg/036 |
No disk SLA throughput. |
|
cfg/037 |
No disk SLA IOPS. |
|
cfg/028 |
Disk mapping counter failed. |
|
cfg/029 |
Last hardware change counter failed. |
|
cfg/030 |
NIC counters failed |
|
cfg/017 |
Due to sysprep of the VM your Windows SID has changed.
You need to redeploy the Azure monitoring extension for SAP as described in the section 3 Redeploy after sysprep . |
|
str/007 |
Access to the storage analytics failed. As population of storage analytics data on a newly created VM may need up to half an hour, the error might disappear after some time. If the error still appears, re-run the setup script. |
|
str/010 |
No Storage Analytics counters. |
|
str/009 |
Storage Analytics failed. |
|
wad/004 |
Bad WAD configuration. |
|
wad/002 |
Unexpected WAD format. |
|
wad/001 |
No WAD counters found. |
|
wad/040 |
Stale WAD counters found. |
|
wad/003 |
Cannot read WAD table. There is no connection to WAD table. There can be several causes of this: 1) outdated configuration 2) no network connection to Azure 3) issues with WAD setup |
|
prf/011 |
Perfmon NIC metrics failed. |
|
prf/012 |
Perfmon disk metrics failed. |
|
prf/013 |
Some prefmon metrics failed. |
|
prf/014 |
Perfmon failed to create a counter. |
|
cfg/035 |
No metric providers configured. |
|
str/006 |
Bad Storage Analytics config. |
|
str/032 |
Storage Analytics metrics failed. |
|
cfg/033 |
One of the metric providers failed. |
|
str/034 |
Provider thread failed. |
Detailed Guidelines on Solutions Provided
| 1. Run the setup scriptDownload the latest version of the SAP specific PowerShell cmdlets.For more information, read the SAP NetWeaver on Azure Virtual Machines – Deployment GuidePlease (re-)run the setup script.Note that some counters might need up to 30 minutes for provisioning.If the errors do not disappear,contact support. |
| 2. Contact supportUnexpected error or there is no a general known solution. Collect the AzureEnhancedMonitoring_service.log file located in the folder C:\Packages\Plugins\Microsoft.AzureCAT.AzureEnhancedMonitoring.AzureCATExtensionHandler\<version>\drop and contact support for further assistance. |
| 3. Redeploy after sysprep If you plan to build a generalized sysprep’ed OS image (which can include SAP software), it is recommended that this image does not include the Azure monitoring extension for SAP. You should install the Azure monitoring extension for SAP after the new instance of the generalized OS image has been deployed.However, if your generalized sysprep’ed OS image already contains the Azure monitoring extension for SAP, you can apply the following workaround to reconfigure the Azure monitoring extension for SAP, on the newly deployed VM instance:
a) On the newly deployed VM instance delete the content of the following folders: C:\Packages\Plugins\Microsoft.AzureCAT.AzureEnhancedMonitoring.AzureCATExtensionHandler\<Version>\RuntimeSettingsC:\Packages\Plugins\Microsoft.AzureCAT.AzureEnhancedMonitoring.AzureCATExtensionHandler\<Version>\Statusb) Run the SAP specific PowerShell script against the newly deployed VM instance. |
| 4. Fix internet connectionThe Microsoft Azure Virtual Machine running the SAP Monitoring requires access to the Internet. If this Azure VM is part of an Azure Virtual Network or of an on-premises domain, make sure that the relevant proxy settings are set. These settings must also be valid for the LocalSystem account to access the Internet. For more details, check the SAP NetWeaver on Azure Virtual Machines – Deployment Guide.In addition, if you need to set a fix static IP address for your Azure VM, do not set it manually inside the Azure VM, but set it using Azure PowerShell or Azure portal https://azure.microsoft.com/en-us/blog/static-internal-ip-address-for-virtual-machines/. The fix IP is propagated via the Azure DHCP service.Manually setting a static IP address inside the Azure VM is not supported, and it might lead to problems with the SAP monitoring extension. |