Deadlock Analysis (Advanced)
With this blog my small deadlock serie will be completed. We started with the basics, then we discussed several examples and today we will close up with a more advanced approach to solve deadlocks.
The intention to build this solution was to get the complete transactions that led to the deadlock, as in some cases the first part of the deadlock (getting the first set of locks) is important to understand and to solve the deadlock. There are three phases in this approach: Collect, Prepare and Analyse, as also described in SAP note 1774085.
- Collect
In the Collect phase we have to set up an SQL Server Profiler trace to get all the statements that belong to the participating threads. Download the attached 'Scripts.zip' archive and extract it to any directory. To set up and start the profiler trace, proceed as follows:
-
Log on to your SQL Server with the <sid>adm user or any other local administrator
When using SQL Server 2005 or higher:
Open the registry and navigate to
[HKEY_LOCAL_MACHINE\SOFTWARE\Microsoft\Microsoft SQL Server\Instance Names\SQL]
and find your SQL Server Instance name on the list (MSSQLSERVER = Default Instance). Keep the Data value of your instance (e.g. MSSQL.1).< BR >
Change the registry key "NonAlertableErrors" at this place (replace <XXX> with the found data)
[HKEY_LOCAL_MACHINE\SOFTWARE\Microsoft\Microsoft SQL Server\<XXX>\SQLServerAgent]
Change "NonAlertableErrors"="1204,4002" to "NonAlertableErrors"="4002"< BR>
- Restart the SQL Server Agent Service.
Open a new query window in the SQL Server Management Studio and switch to the master Database
Load the file "Setup Delayed Profilerstop at Deadlock.sql" from the COLLECT directory of the extracted archive and change the line 442 that starts with
set @DirectoryName = N'C:\.....'
to a file location with enough free space. The default is the directory c:\temp. For SQL Server 2005 and higher you need at least 2.5 GB free space in this directory.
Save and run the changed script. It will return the ID of the created trace (usually the number 2) and a list of active traces. The trace with the ID = 1 is the built-in default trace in SQL Server 2005 and higher.
The script will create and start an SQL Profiler Trace, a SQL Agent Job and an Alert for the SQL Error 1204 (Deadlock). The trace will write trace files that are 250MB in size. In SQL 2005 and higher the amount of files is limited to 10, under SQL 2000 there is no such limit of files created. Please watch the directory to avoid that the disk is filled up. You can delete older trace files, but you should keep at least the five newest files.As soon the error 1204 occurs in that database, the alert gets fired and will invoke the SQL Server Agent Job. The job will stop the trace after 20 seconds and will cleanup all the created stored procedures and the job itself. This will help you. if the deadlock occurs in the night, as it will then stop when the deadlock occurs and not when you are available. If you have several different deadlocks happening in the system, the Alert will fire at the first deadlock, but the trace might contain more than one, as there might be additional deadlocks in the 20 seconds that are used to get the winner transaction.
If you want to stop the trace manually, just start the job with the name 'Stop Profiler at Deadlock'. This will stop the trace and will remove all the objects that the script has created.
When using SQL Server 2005 or higher: When done, revert the NonAlertableErrors in the registry to the original value and restart the SQL Server Agent Service.
Save the generated trace files.
The trace runs in the background and consumes a maximum of 1.25 GB of disk space. It stops automatically when the first deadlock occurs. Once the profiler trace has started, try to reproduce the deadlock. Once the deadlock occurs, the trace stops automatically shortly afterwards.
These steps are also described in the read me file in the archive.
Prepare
In this step, the trace is imported into a new database to analyze it. Open the SQL Server Management Studio and connect to the SQL Server instance, where you want to perform the analysis. This does not have to be the instance where the deadlocks occur. It is recommended to NOT run the analysis on the productive SQL Server instance, even when the deadlock occurs there.
Open the script 'Step 1 - Read Into a Table.sql' from the PREPARE directory of the extracted archive into the query editor and do the following changes:
Ensure that the name [DeadlockBlogAdv] is not used on your system as a database name or replace all [DeadlockBlogAdv] entries with a name of a temporary database.
Change the path and filename of the line that looks similar to this:
FROM fn_trace_gettable ('C:\Temp\SAP-SQLTrace-2012.10.09-14.11.21', default);
Change it to the path and filename of the first file of the collected profiler trace of the Collect step. The SQL Server will then read this file and all subsequent files of the same trace that have the same name and trailing, increasing numbers (e.g. _1, _2 etc.).
Execute the script. It creates the database and a trace table and reads the given trace file and all subsequent existing files into this table. Furthermore, it creates some helpful indices on the table to speed up the identification process of the deadlock transactions. If full text search is installed it creates a full text index on the TextData column to enable fuzzy searches. It returns the start and end time of the trace and the amount of rows imported. As a last speed it will shrink the log of the database as it no longer needed.
Open the script 'Step 2 - Create Data View. sql' and execute it in the same database as the first one. It creates a view over the Trace table to get more readable information from the trace.
Analysis
As we now have everything prepared, please open and execute the script 'Step 3 - Get Winner and Victims. sql' from the ANALYSIS directory. It reads the deadlock graph(s) from the trace (the same graph(s) that you get when you follow SAP note 32129 ) and extracts the winner and victims of the deadlock.
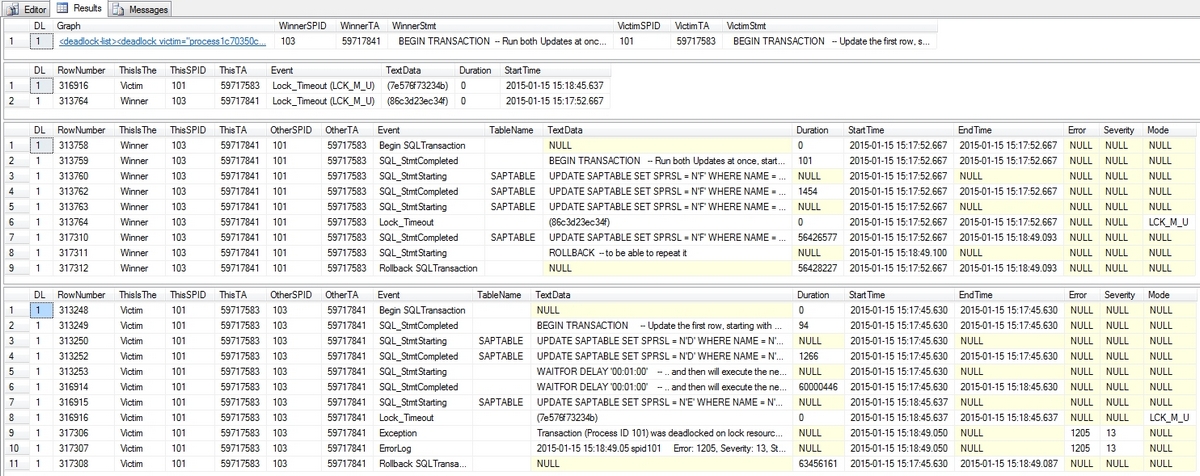
The result is separated in four sets:
- The first one gives you a clickable link to open the deadlock in a XML view and a overview over the transactions and their last statements. When you save the XML as a xdl file you can get the same output as in my last blog posts.
- The second set lists the exact time of the deadlock (when the lock timeout occurs) and the row numbers in the trace file.
- The third and fourth set gives you the complete transactions of the winner (top) and victim (bottom) transaction. The victim transaction always ends with a 'Lock_Timeout' followed by an exception in the EventClassDesc column which you find close to the bottom. The statement that caused the deadlock is shown before the 'Lock_timeout' as 'Statement Starting' with no matching 'Statement Completed'. The winner also shows a 'Lock_timeout' at the same time, but with the 'Statement Completed' of the Deadlock Statement right after the 'Lock_Timeout'.
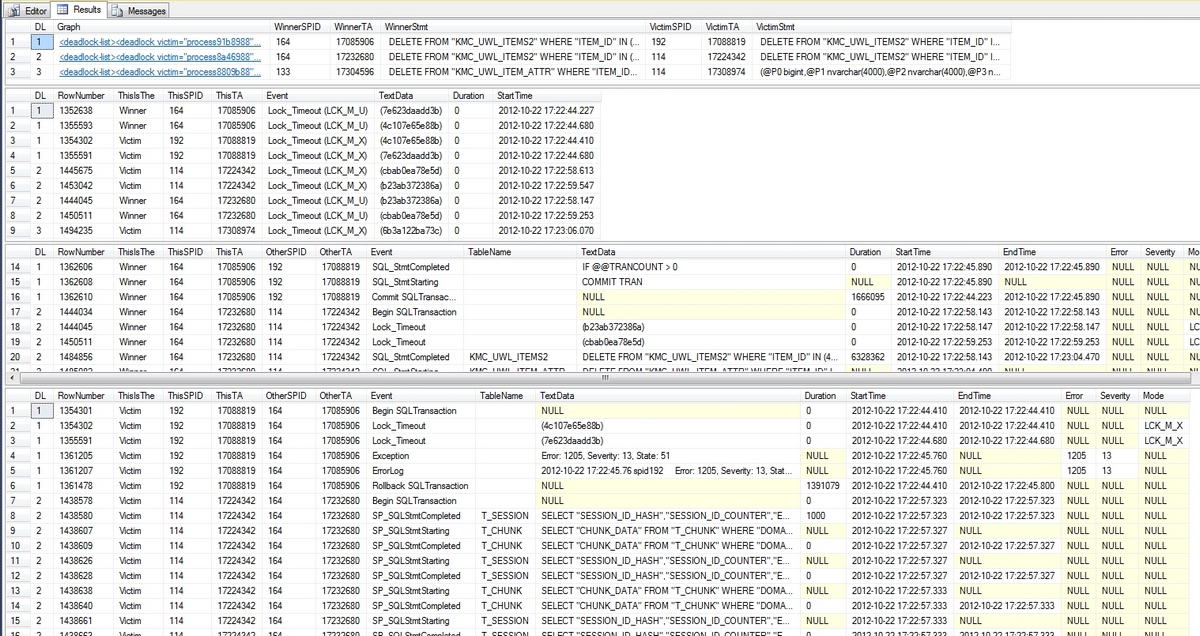
I have seen multiple victims against one winner. This happens when the winner has already a lot of log generated (see the basics ) and multiple, very fast victims loose against the winner in a short period of time.If the trace contains multiple deadlocks the output looks like this:
The different deadlocks can be separated by the column DL (Deadlock) and the matching DL number. In this trace we captured three deadlocks, which are listed here. As an example you can see that in deadlock number 1 the winner and victim deadlocked twice against each other (at 17:22:44.410 and 17:22:44.680). The same is true for deadlock number 2.
With this information, you can identify when (Column StartTime) each session (SPID) has acquired locks (TextData) on the given tables (Column TableName). This information can help you to understand the deadlock and then either to modify the application or to create or modify indexes to avoid the deadlock.
Have a nice and deadlock free day.
Clas