Client Aware Parameter for Multiple Clients has been Defaulted to Enabled
Summary
Customers running SAP systems with multiple clients may intermittently observe slow performance on some queries. Sometimes the same query will run very quickly and sometimes the query will be very slow. This problem is most likely to occur on systems with one very large client containing most of the data in the SAP system and one or more very small clients containing only a tiny amount of data. SAP has now defaulted the profile parameter dbs/mss/client_aware to 1 thereby enabling “client aware” behavior without the need to set any profile parameters.
1. Description of the Problem
In certain circumstances customers may notice ABAP transactions, reports and batch jobs are sometimes very fast and sometimes very slow. If such a problem is observed then it is recommended to analyze the problem further.
We recommend to follow this checklist:
1. Does the system has more than one client with production data?
2. Does one or several of the clients have a lot of data, around 70-80% of data?
3. Does one or more of the clients have a very small amount of data, typically less than 15%
4. Capture an ABAP ST05 trace when the query is running slowly and when the query is running fast using the steps below:
a. Run Transaction SM66 and find which SAP application server is running the report or batch job
b. Use Transaction SM51 to jump onto the SAP application server running the report or batch job (ST05 only traces the local SAP application server and not all SAP application servers)
c. Start ST05 and set a filter by username, report or workprocess
d. Capture the ST05 trace and try to find a long running SQL Statement (which should be highlighted in red)
5. The normal pattern seen in the ST05 trace with this problem is:
a. When the system is running “normally” the query will do a lookup into a Secondary Index
b. When the system is running “slowly” the same query can be seen doing a scan on the Primary Clustered Index
2. How to Estimate How Much Data is in Each Client?
DBA Cockpit can quickly diagnose most performance problems. It is highly recommended to become familiar with some of the more advanced features of DBA Cockpit.
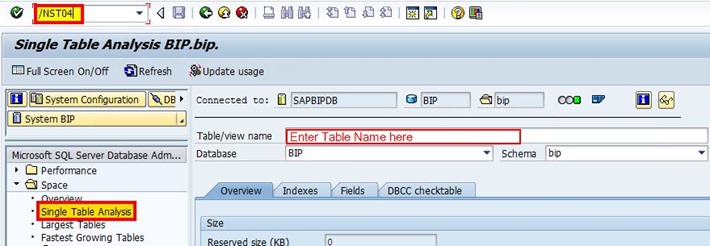
After isolating the table(s) in the poorly performing queries using the procedure listed in section 1 above, run transaction ST04 -> Space -> Single Table Analysis and enter the table name into screen below
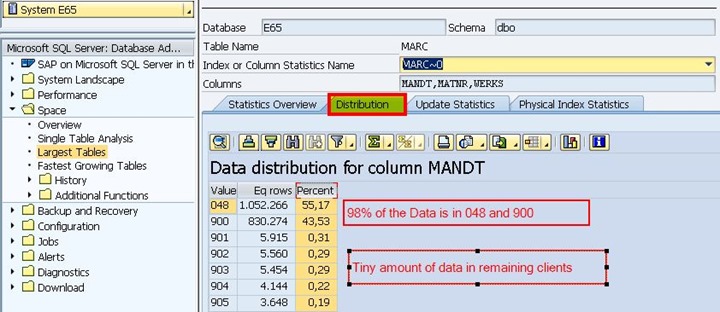
After the table properties are displayed click on the Indexes tab. Select the Primary Index (<TABLENAME>~0) and press the Distribution button
The Distribution tab will show the number of rows and more importantly the percentage of data in each client. Such a distribution between 048, 900 (lots of data) or 901, 902, 903, 904, 905 (very little data) can lead to the problem described in this blog
Clients 000, 066 and other system type clients can be ignored as they typically do not contain data and users/admins seldom logon to these clients
3. Why Does this Problem Occur?
SQL Server like most other DBMS uses caching mechanisms to reduce CPU consumption and improve performance. SQL Server has many caches, the most well-known are the Data Cache (holds data) and Statement Cache (holds compiled prepared statements).
SQL Server will compile a SQL Statement and cache an execution plan the first time the SQL Statement is executed. SQL Server will optimize the plan based on the values of the parameters that were used the first time the query was run. Because a statement is optimized, then cached and reused by all subsequent queries, the values of parameters when the query is first executed determine the plan efficiency for all subsequent executions.
Using the screenshot above as a reference example:
1. The “best” (most efficient plan as calculated by the optimizer) is different depending on whether client 048, 900 (lots of data) or 901, 902, 903, 904, 905 (very little data)
2. The “best” plan for clients 901, 902, 903, 904, 905 with only a tiny amount of data is to scan the clustered index (as accessing secondary indexes always involves some overhead)
3. The “best” plan for a query with client parameters equal to 048 or 900 is going to be a secondary index look up
4. When the customer experiences poor performance it is possible the follow scenario is occurring:
a. SQL Server is restarted (purging cache), statistics on table are updated or some kind of DDL operation forces SQL optimizer to build a new plan the next time the query is run
b. The first time a particular ABAP report or batch job is run the user is logged into client 901 or 902 or 903 or 904 or 905
c. SQL Server compiles and caches a plan that is “best” for client 901, 902, 903, 904, 905 but highly inefficient for a clients 048 or 900 (lot of data)
d. Performance will be good for queries on the client with a small amount of data, but poor performance for the clients 048 or 900 (lot of data)
3. How to Resolve This Problem?
SAP has now defaulted the client aware setting. This change is included in the following kernel patches:
720 = to be confirmed
721 = 314 1716826 - Usage of the downward compatible kernel 721 (EXT)
7.40 = to be confirmed. Recommend to use 7.41 DCK kernel when available 1969546 - Release Roadmap Kernel 740
7.41 = 41 1969546 - Release Roadmap Kernel 740
If a system is experiencing the exact scenario discussed in this blog and the kernel cannot be updated, then there is an easy and simple fix to resolve this problem. SAP Note 1148380 - client awareness contains a profile parameter dbs/mss/client_aware = 1
This parameter must be set in the default.pfl. Do not set this parameter in the instance profile
4. What Exactly is This Parameter Doing?
The “client aware” setting is changing the way that the SAP ABAP engine formats T-SQL statements that get sent to the database. As a result each SAP client will have its own individual query plan compiled and stored in cache. This will mean that the optimal or “best” plan will be compiled and cached for each client.
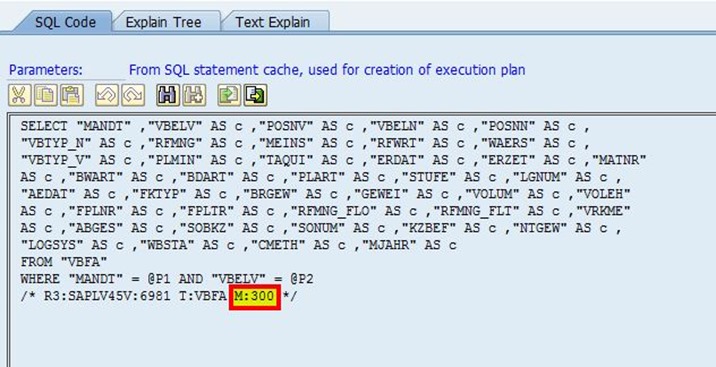
The screenshot below shows that each ABAP statement has a comment added in between the /* and the */.
The R3: contains the ABAP program name and line number
The T: contains the table name. The table in this statement is VBFA
The M: is added when dbs/mss/client_aware is set to 1. The value contains the client that generated the statement in this case 300.
SQL Server treats any difference in a SQL statement including comments as a new and unique statement. This causes the SQL Server Query Processor to compile and cache a plan for each individual client
5. Can “Client Aware” Setting Cause Any Side Effects?
The client aware setting may cause SQL Server to store more plans in cache and might increase the amount of memory required by the plan cache. This parameter has been widely deployed and tested in multiple customer scenarios and we have never observed any adverse impact. It is recommended to run a modern version of SQL Server and to ensure hardware configurations are adequate. See SAP Note Note 1612283 - Hardware Configuration Standards and Guidance for more information on recommended hardware configurations.
It is possible to disable this behavior but do not do this unless instructed to by SAP Support.
6. How to Monitor Cache Sizes on SQL Server?
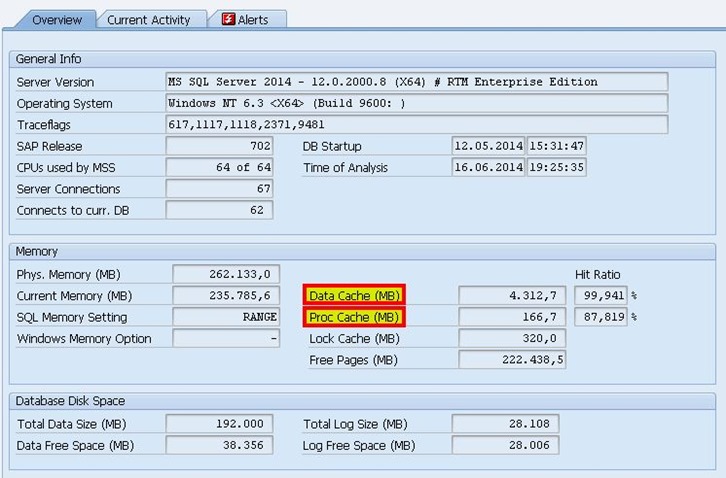
There are two simple ways to monitor cache size and hit ratios. The first is to simply run transaction ST04. Data cache is a buffer for database tables and indexes. Proc Cache is the statement cache.
If more detailed information is required this statement can be run:
select * from sys.dm_os_memory_clerks order by pages_kb desc
Additional points:
Do not set this parameter if running SQL 2012 SP1 CU3, 4, 5 or 6 as an issue has been detected in these releases. Please see topic 4 in this blog SAP on SQL General Update for Customers & Partners April 2014
It is highly recommended to review these webcasts explaining how to use DBA Cockpit for SQL Server. This four part series by Leslie Moser can be found here: 1, 2, 3 and 4
62988 - Service packs for MS SQL Server
159171 - Recompilation of SQL Statements
724047 - performance problems after client import
1148380 - client awareness


