SQL Server 2012 AlwaysOn – Part 12 – Performance Aspects and Performance Monitoring II
[Edit] You can find the summary of the complete series here.
Moving to synchronous availability mode
One thing we are not measuring in our tests with asynchronous availability mode is the impact of latency to transport the changes over to the secondary replicas. Looking in an earlier blog where we described the principle mechanisms of AlwaysOn (https://blogs.msdn.com/b/saponsqlserver/archive/2012/02/07/sql-server-2012-alwayson-what-is-it.aspx), it becomes clear that in the synchronous availability mode we delay the commit acknowledge to the application by the time it takes to transport the data, persist the data on the synchronous secondary replicas and to send the acknowledgments back from the secondary replicas. This delay in the commit is the first order impact. However what can be even more severe to the application are second order impacts database locks on the rows changed are held until acknowledges come back. This can throttle concurrency in a serious manner and with that the volume of business transactions processed.
In earlier blogs we already talked about the limits in distance which likely make sense and which don't make any sense anymore. But given complexity of todays infrastructure, one needs to test in any particular case on whether one can afford to run synchronously.
What is the transaction delay we are experiencing?
Running in synchronous availability mode, the best way to find out what the delay introduced is, is to check two performance counters on the primary replica:
- SQL Server:Database Replica --> Transaction Delay
- SQL Server:Database Replica --> Mirrored Write Transactions/sec
The first value is an accumulation of the delay of all the current transaction delay in millisecond
The second counter is the value of transactions which indeed caused data transfer with AlwaysOn (in opposite to SQL Server:Database - Transactions/sec which does include pure read transactions as well).
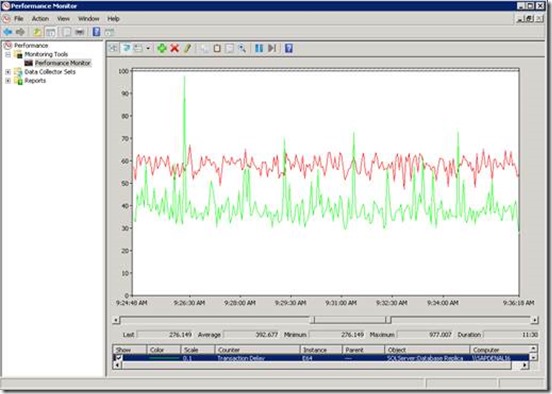
In order to get to the average transaction (in principle commit delay) one only has to divide both values. In the screen shot below we look at an average Transaction Delay of 392 milliseconds (green line in 0.1 scale) and around 60 Write Transactions/sec (red line in scale 1.0). Calculating the numbers, we look at a transaction delay of around 6.5ms.
Another also easy method to see what latency got introduced with choosing synchronous availability mode is to execute this query on the primary replica instance:
select wait_type, waiting_tasks_count, wait_time_ms, wait_time_ms/waiting_tasks_count as'time_per_wait'
from sys.dm_os_wait_stats where waiting_tasks_count >0
and wait_type = 'HADR_SYNC_COMMIT'
The result can look like:
This is telling us that the synchronous availability mode is introducing a latency of 4ms committing transactions. Please be aware that the counter in sys.dm_os_wait_stats is accumulated since the startup of the server. Means it is covering workload peaks as well as time period of rather low workload. Whereas with Performance Monitor one can focus on certain time periods and workload periods.
A more alarming scenario in regards to latency introduced is when this query:
select session_id, status,command,blocking_session_id, wait_type, wait_time, last_wait_type from sys.dm_exec_requests where session_id>=50
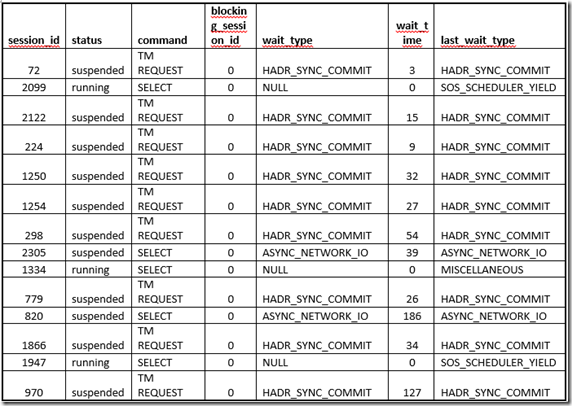
results in such an output:
Looking at the column wait_type, we immediately see that a lot of the sessions are waiting on wait_type ‘HADR_SYNC_COMMIT’. This wait_type tells us that we are waiting on commit processing by the secondary replicas which are running with synchronous availability mode.
In a system where the latency conditions between the primary and secondary are fine, it is usual to hardly see this wait_type showing up. Here and there might be one or two sessions waiting, but if, like above the majority of the sessions do show up with this wait_type, there is a problem. In the case above the SAP application did suffer severely by these waits in the double digit millisecond range. Repeated and continuous results like this should trigger investigations in why the latency is so high. Is it that the distance or at the end communication lines are too long or is it that the network bandwidth is not what it was when evaluating the workload and the configuration earlier. Or did the workload change so dramatically.
How much data are we actually sending to the replicas – how do the numbers add up
What we didn't look at is how all the different counters we recorded earlier do add up and how those can tell how much data we are sending and returning.
How many sends are done and how much data volume is sent?
Performance Monitor is a great tool to answer this question. Looking at the following counters:
- SQL Server:Availability Replica --> Bytes Sent to Replica/sec
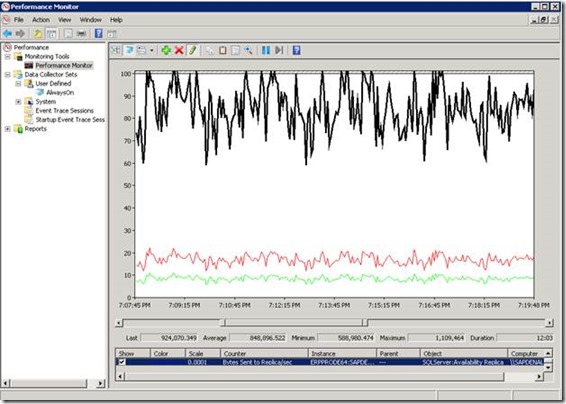
Total and specific for each secondary replica instance will show exactly how many bytes were sent. We are looking at a scenario where one secondary replica is working in synchronous and the other in asynchronous availability mode.
When using the original scale of each of the counters (Bytes Sent to Replica/sec for Total, and the two specific instances), we only saw two lines. Expectation is that if everything works great also to the asynchronous replica, the two lines of Bytes Sent/sec to both replicas is absolute identical. In order to make clear that we are looking at two different instances plus the Total value, I changed the scale for one instance. This created the black and green line as values to the individual instances. The red line is the Total Bytes Sent to both replicas and as a result double the value of the green one (and if scale adjusted double of the black one as well).
Another counter which can be checked is the counter:
- SQL Server:Availability Replica --> Sends to Replica/sec
Again we are expecting to see the same values of sends going to all replicas and the number of sends being the sum of all the sends to the secondary replicas.
In our example we used here for demonstration purposes the values looked around:
- Bytes Sent to Replica/sec Total: 1.7MB.sec
- Sends to Replica/sec Total: 131
This tells us that we got around 13KB per Send.
In the counter collection of SQL Server:Database Replica, we also find a counter called
‘Bytes Sent to Transport/sec’. You will realize that the number of bytes is a touch higher. This counter actually represents the real number of bytes as those went on the wire. Similar is true for the counter ‘Sends to Transport/sec which we usually observe to be one send per replica higher than the counter ‘Sends to Replica/sec’ shows. This is normal and no reason to worry.
From a Primary Perspective what comes back from the secondary replica(s)?
First and foremost the secondary replicas are supposed to send back acknowledgment about having persisted the incoming data sent from the primary. In Database Mirroring the return of the acknowledge was the same for a synchronous as well as asynchronous configuration of the mirror. The moment the change records were persisted in the log of the mirror, the acknowledge got sent back. AlwaysOn introduces a change to offload the network a little bit in the asynchronous case. In case of the asynchronous availability mode, the acknowledges are collected up to 64 and then sent back to the primary in one packet. Or if within 1 sec, we don't get 64 acknowledgments together one will send a packet with less than 64. Whereas the synchronous availability mode still receives acknowledgment packages for single ‘Sends’ to the replicas.
The counter we want to look at would be
- SQL Server:Availability Replica --> Receives from Replica/sec
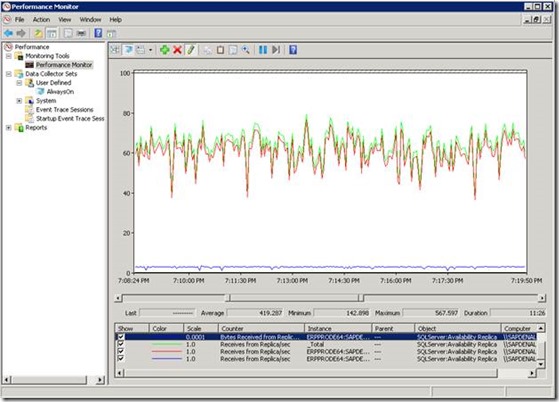
In our scenario of having one synchronous and asynchronous replica, this change would look like:
The green line which is a bit higher would represent the Total Receives of the primary from both replica. Whereas the red line would be number of receives of the synchronous replica. Both lines seems to fluctuate quite a bit driven by the workload. Whereas hardly above the ground with 2.3 receives per second we see the number of receives from the asynchronous replica.
Looking at the byes received from the Replicas, we are expecting extreme small volumes. E.g. in the scenario where we sent 1.7MB/sec in 131 Sends/sec Total, we got back 2.3KB/sec.
Other counters which we ideally expect being below 1 would be:
- SQL Server:Availability Replica --> Flow Control Time (ms/sec)
- SQL Server:Availability Replica --> Flow Control Time
- SQL Server:Availability Replica --> Resent messages/sec
First two counters would indicate that the queue in the actual layer sending the messages on the network is full. Hence this would indicate a network issue. The wait_type ‘HADR_DATABASE_FLOW_CONTROL’ in sys.dm_os_wait_stats would indicate a similar problem.
Something is wrong here – we are persisting more data in the primarys transaction log than we are sending to the replica
When looking through all the counters we told to record at the beginning and look and compare those, it becomes apparent that they seem not to add up.
Let’s compare the following counters:
- SQL Server:Availability Replica --> Bytes Sent to Replica/sec
- SQL Server:Availability Replica --> Sends to Replica/sec
- SQL Server:Database --> Log Bytes Flushed/sec
- SQL Server:Database --> Log Flushes/sec
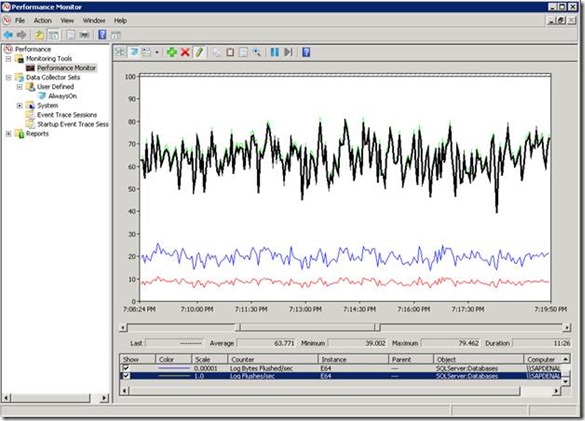
Knowing how AlwaysOn works, the expectation would be that the # of Sends/sec to one of the replicas pretty much would be the same as the # of Log Flushes/sec. One would have a similar expectation for the # of bytes flushed into the primarys transaction log since all those change records need to make it over to the secondary replicas. However comparing these counters for an AG with one database only, this picture emerges:
The black and the green line on top represent the Log Flushes/sec and the Sends to Replica per Second. Pretty much a similar line with the same values. However we do see a difference between blue line representing the Log Bytes Flushed/sec and the Sends Bytes to Replica/sec. it looks like we are writing more volume to the primarys Tlog.
Reason for this difference is the fact that besides encrypting the data which goes over the network to secondary replicas, SQL server also compressed the data sent to the replicas in order to reduce network bandwidth requirements. In our example case we saw the following values:
- Bytes Sent to Replica/sec for one specific replica: 850KB/sec
- Log Bytes Flushed/sec for the only database in the AG: 1950KB/sec
- Means all in all we are looking into a compression rate of around 2.3
Using DMV to monitor the AlwaysOn configuration
Since a lot of folks will try to write procedures or scripts which either are going to be used for immediate querying of status of AlwaysOn or as scheduled scripts which dependent on the outcome will send alert emails, let's go through a few of the cases which we can or want to monitor.
Are all my systems in my AG onboard?
Probably one of the most important question first. From the perspective of the AG are all the instances running a replica online and in the availability mode we expect them to be.
This one can be checked on the primary with this query:
SELECT ag.name AS ag_name, ar.replica_server_name AS ag_replica_server, dr_state.database_id as database_id,
is_ag_replica_local = CASE
WHEN ar_state.is_local = 1 THEN N'LOCAL'
ELSE 'REMOTE'
END ,
ag_replica_role = CASE
WHEN ar_state.role_desc IS NULL THEN N'DISCONNECTED'
ELSE ar_state.role_desc
END ,
ar_state.connected_state_desc, ar.availability_mode_desc, dr_state.synchronization_state_desc
FROM (( sys.availability_groups AS ag JOIN sys.availability_replicas AS ar ON ag.group_id = ar.group_id )
JOIN sys.dm_hadr_availability_replica_states AS ar_state ON ar.replica_id = ar_state.replica_id)
JOIN sys.dm_hadr_database_replica_states dr_state on
ag.group_id = dr_state.group_id and dr_state.replica_id = ar_state.replica_id;
The ideal result would look like:
In our usual configuration of one synchronous and asynchronous secondary replica, this is what we would expect to see.
- The Synchronization State of the asynchronous replica always is ‘SYNCHRONIZING’ which to a degree is the same state for the case where a replica either joins or resumes and needs to catch up with changes.
- If we got see the ‘SYNCHRONIZING’ state in combination with the ‘SYNCHRONOUS_COMMIT’ availability mode, then this replica is trying to catch up either because it just got resumed or it just joined the AG.
- If a replica gets suspended, we still will see that it is ‘CONNECTED’, however the Synchronization State will change to ‘NOT SYNCHRONIZING’
- If we would lose connectivity with the server/instance or issues with the WSFC configuration would interfere with the functionality of the instance which is running a secondary replica, the Connectivity State would change to ‘DISCONNECTED’ in combination with ‘NOT SYNCHRONIZING’
Analyzing these few columns will enable figure out whether the AG is complete as it should be or whether one of the secondaries encountered some problems.
How far is a secondary back?
We already described the way how to detect how many bytes on Log queue or Redo queue were accumulated. However especially in cases where a secondary got resumed or simply taken down the log queue the number of bytes which have not made it over to the secondary yet is not too descriptive. Ideally we would like to know how to express this in seconds or minutes.
This could be figured out with this query:
SELECT ag.name AS ag_name, ar.replica_server_name AS ag_replica_server, dr_state.database_id as database_id,
is_ag_replica_local = CASE
WHEN ar_state.is_local = 1 THEN N'LOCAL'
ELSE 'REMOTE'
END ,
ag_replica_role = CASE
WHEN ar_state.role_desc IS NULL THEN N'DISCONNECTED'
ELSE ar_state.role_desc
END,
dr_state.last_hardened_lsn, dr_state.last_hardened_time, datediff(s,last_hardened_time,
getdate()) as 'seconds behind primary'
FROM (( sys.availability_groups AS ag JOIN sys.availability_replicas AS ar ON ag.group_id = ar.group_id )
JOIN sys.dm_hadr_availability_replica_states AS ar_state ON ar.replica_id = ar_state.replica_id)
JOIN sys.dm_hadr_database_replica_states dr_state on ag.group_id = dr_state.group_id and dr_state.replica_id = ar_state.replica_id;
the result could look like:
As one can see, the one replica already did not get synchronized for more than 6minutes. One as well could write alerts on the time frame you want to tolerate.
There are many more situations which one could monitor. We will describe them over the course of the year. An interesting question could e.g. be whether a failover did happen. We had in the many years of using Database Mirroring or AlwaysOn again and again the situation that failovers did happen w/o anybody noticing at the point in time. Hence it could be great to have a script that does alarm. Let’s see.
