Measuring Memory Consumption of SAP Application Server Instances
Since the 'Green-IT' movement is becoming serious, leverage of server resources or power consumption of existing resources is right in the middle of attention. One of the things analyzed is how much CPU is used on each of the servers and whether one could load a little bit more onto a server when one finds sufficient free CPU resources. Another angle people start looking into is the memory consumption of servers. As shown here, analyzing servers with the SAP Netweaver stack on memory usage is not that easy as it seems from the outside. When the analysis is done by people who are less familiar with the SAP implementation, the SAP Basis team suddenly could find itself confronted with the statement that there hardly is any memory used by the SAP application instances. As it happened with one of our customers. The folks performing the analysis sent the SAP Basis Team statistics stating that out of the 64GB real memory there were steadily 54GB memory available according to Windows Performance Monitor counters. Something that the SAP Basis Team knew that it could not be true. But how to show the truth? Here is how you show the real memory consumption and what the traps are, people are falling into.
In Windows Server 2003, the Windows Task Manager is partly right and partly wrong. Reason for this is the way how SAP creates their central part and largest chunks of memory. The so called Extended Memory is created either as as memory mapped file or as a huge chunk of shared memory (PHYS_MEMSIZE parameter in the SAP instance profiles). The memory defined as Memory Mapped File or Shared Memory is not subtracted from the 'Available Memory' in the Windows Task Manager (see below) or the Windows Performance Counter with the same name (Perfmon--> Memory -->Available Bytes or Available KBs or Available MBs). Let’s look at a screenshot of the Task Manager and go through a few of the numbers
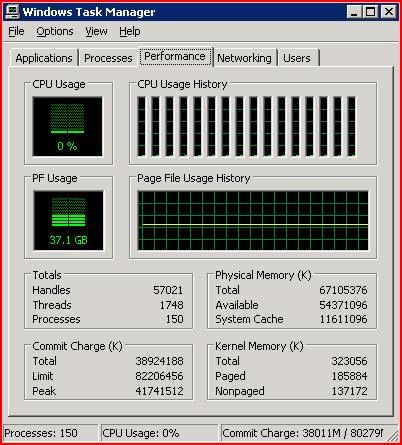
We are looking at a server with 64GB real memory (Physical Memory block - 'Total'). However the row 'Available 'claims still to have 54GB available despite the fact that there are two SAP ABAP instances with 12GB Extended Memory each. Reason for this discrepancy is that 'Available' is calculated by subtracting memory associated to processes from the real memory. Both memory mapped files and shared memory as used by SAP are not completely associated to a process. Hence only fractions of it are taken into account. Nevertheless the memory configured for the SAP instance needs to be taken into account. This can be done by using Performance Monitor and focus the monitoring on Memory--> Committed Bytes. This counter will correctly reflect the memory allocated for the SAP instances and might show like in the case above around 37GB. These 37GB also are reflected in Task Manager under the graph of PF Usage (Page File Usage) or in the block 'Commit Charge' in the lower left corner of Task Manager. Both are giving the accurate numbers on real memory consumption and are the numbers of interests. If the peak value of committed memory exceeds the real memory, then it indicates that there were situations where Windows had to page out memory of processes into the page file in order to make space for other processes in real memory. Something which can hurt performance. Especially on SAP JAVA application instances. Ideally we don't see the Peak number of committed memory going beyond the real memory of the server.
Unfortunately Windows Server 2008 did take a step back in showing how memory is consumed
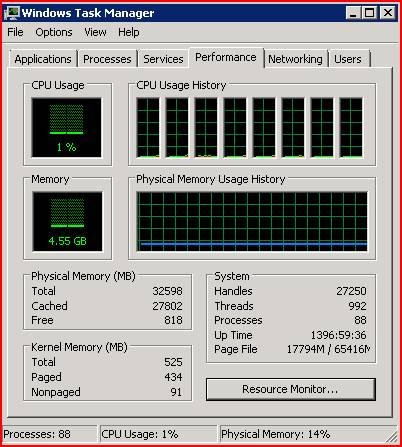
Would one believe it, we are running 2 SAP ABAP instance on this system. Every instance has 5GB Extended Memory. Instead of ‘Page File Usage’, the ‘Physical Memory Usage’ is displayed now. This one unfortunately is not based on the committed bytes and hence doesn't count the shared memory segments and extended memory of SAP ABAP instances completely. Besides the performance Counter 'Committed Bytes', the correct numbers in the W2K8 Task Manager are in the last item in the 'System' block. It is called ‘Page File’. The first value of ‘Page File’ gives you the REAL committed memory and the second gives you the maximum which can be committed (real memory plus page file(s)). Again the Perfmon item ‘Committed Bytes’ is the one to monitor.
That only is in regards to application servers without SQL Server. With SQL Server we wouldn't confuse any of those values above since the memory allocated by SQL Server steadily is attached to a process. However where confusion kicked in was when looking on the memory associated with the sqlservr.exe process in the Processes pane of the Windows Task Manager. SQL Server leveraging Large Pages on 64Bit or AWE under 32Bit has the effect that you can’t see how much memory SQL Server uses when you are looking in the ‘Processes’ tab in Task Manager. See this screenshot:
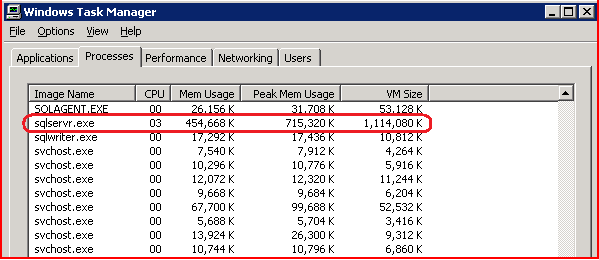
It is not apparent that on this dedicated Database Server the SQL Server process on this system allocated around 58GB for SQL Server's Buffer Pool. A way how to find that out is to check these Performance Monitor Counters:
Memory --> Committed Bytes or Memory --> Available MBytes in the case of SQL Server and the way SQL Server allocates the memory, these counters indeed work perfectly.
SQL Server --> Buffer Manager --> Total Pages will also show the size of the SQL Server Buffer Pool (however not the memory SQL Server allocates outside the Buffer Pool)
Whereas the SQL Server allocations are honored in the Page file Usage Section of Task Manager in Windows Server 2003 and Physical Memory Usage in Task Manager for Windows Server 2008
Hope this helps a bit to evaluate Memory Usage of systems running SAP software.