Understanding Alerts in Azure AD Connect Health
Howdy folks!
Today, I thought I’d talk about the alert system in Azure AD Connect Health. Azure AD Connect Health is a premium feature of Azure AD that offers monitoring capabilities as well as deep insights into the systems that it monitors. It currently supports monitoring ADFS and will be extended to support monitoring the on-premises components of your hybrid identity infrastructure such as sync components of Azure AD Connect as well as Active Directory domain services.
Before we get started, let’s get through some basics.
- Connect Health is targeted at customers who don’t have any or have limited monitoring capabilities on their identity infrastructure. A well monitored identity system is key to having reliable access to applications services such as Office 365.
- You can also run Connect Health alongside SCOM agents as it offers some unique capabilities such as providing insight into logins and additional reports around these.
- As I’d mentioned, you need Azure AD premium for this. For more information, see Getting started with Azure AD Premium. You can also start a free 30-day trial. Check out this link.
There are a few of unique advantages to having a cloud based system for alerting.
- Ability to update alert definitions without requiring admin intervention. Imagine, we released a critical patch to ADFS and want to alert admins on this, we just need to add the alert at the service level and it would just show up for you.
- Ability to look at multiple data points to determine if there is an issue. Often, you need more than a single data point from a server or multiple data points across many servers to determine if it is truly an issue. For example, let’s say your CPU is spiking. To truly alert, we want to look at data points for the last 3 hours before really letting you know if it is an issue. A cloud service truly this makes it possible without putting the burden on you.
- Ability to compare data with other AAD/Microsoft service components. Imagine, wanting to compare the token signing certificate used by ADFS currently with the one stored in the cloud, we can do this all from the service and make it easy.
Let’s now break down alerts into its various components as seen from the navigational flow within the portal. We call this the alert ‘journey’ (a term used for the new Azure Portal that describes a navigational flow).
The Alerts Part
This one is pretty simple to understand and lives on the main dashboard for a service instance (e.g. an ADFS farm)
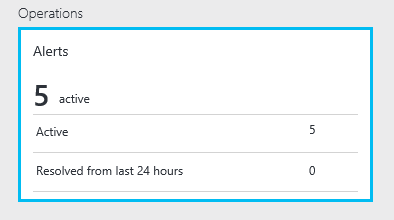
The things to know about this are
- “Active” shows the number of active alerts. This is what you’d care about the most from an operational standpoint. The # of active alerts could either be alerts or warnings.
- “Resolved from last 24 hours” shows the # of alerts that were generated and resolved. This is useful when you want to review past instances that got fixed or to simply let your manager know ‘Hey, I fixed this issue’.
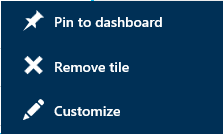
- As with any part within the new Azure Portal, you can always pin a part to your dashboard by just right clicking on the part and clicking “Pin to dashboard’. This is such a core concept in the new portal that focuses on “Pin the parts that you care about the most”.
- Clicking on any location within this part will open up the Alerts “blade”.
The Alerts Blade
This is one of the more important blades for alerts and it is all about showing you an all up view of issues and potentially where the issues are occurring. Let’s dive into the details of this blade.
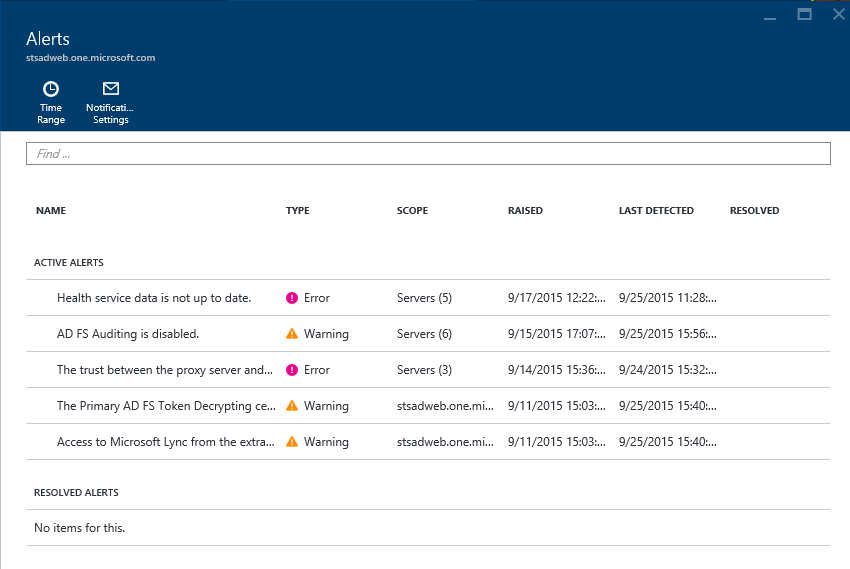
There are 2 sections within the grid, one about active alerts (most important) and the other about resolved alerts. Things you need to know about this blade.
- Within active alerts, the alerts are sorted by when the alert was raised with the most recent one on the top. This way the most recent issues are shown at the top.
- The Typecolumn is to show the severity of the impact. This way, it is clear to you on which needs to be acted upon earlier. Within the service, we deem an alert type to be one of the following:
- Error: These are issues that you should not be having and we need you to fix as soon as possible as this is end user impacting. One exception is that we also deem the “Health service data is not up to date” to be an error if we are not receiving the critical information (e.g. event logs) that enables the services to process and let you know if you have an issue.
- Warning: These are things that we don’t believe to be end user impacting yet, but could be a potential issue in the future. Also, an issue where you are not running in optimal configuration is deemed a warning.
- The ‘Scope’ column gives you the indication of whether the issue is occurring in a single server, multiple servers or impacts the entire service.
- If it is a single server, you will see the server name in the scope column (e.g. ADFS-01)
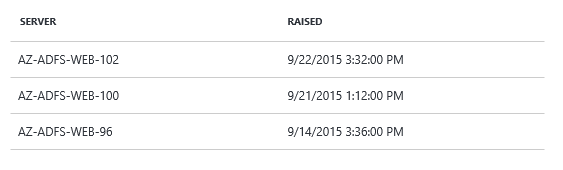
- If it is the same issue on multiple servers, we opted to collapse this into a single row item because it is very likely it is a similar issue but needs to be fixed on each of these servers. It’s just easier to view and operated in a single context.
- If it at the service level, you will see the service name as the value in the scope column. (e.g. adfs.contoso.com)
- The ‘Last Detected’ column provides a timestamp on when we processed data that still makes us think there is an issue. It is very useful to compare it with the ‘Raised’ column (time when we first detected the issue) and provides you a view into how long the issue has been active.
- Note: Every time we check and find the same issue, we don’t raise a new issue and merely update the existing alert with the most recent information.
- The ‘Resolved Alerts’ section provides you a similar view as active, but you’ll see the ‘Resolved’ column now filled with a value. This list is sorted by the ‘Resolved’ timestamp with the most recent being listed first.
- By default, this is list is for the alerts resolved in the last 24 hours. However, you can go change the time range by clicking on the ‘Time Range’ Command at the top of the blade
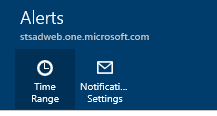
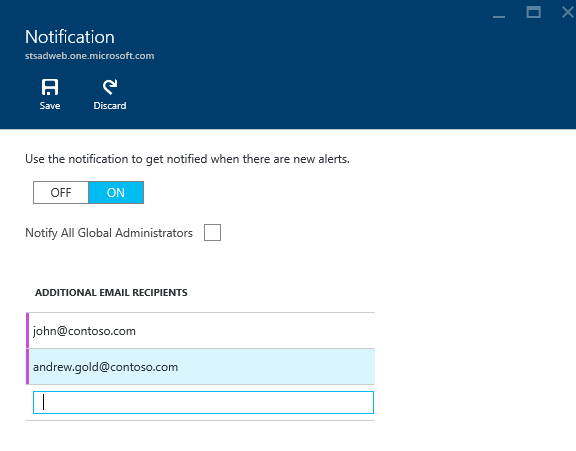
- You can also get email notifications by clicking on the 'Notification Settings' in the command bar on this blade. We opted to provide this at a service instance level (e.g. a specific ADFS farm) versus having one tenant wide setting across all the services. The reason for this is that we've had customers tell us that getting email notifications and its audience can vary based on the service instance. For example, I want email notifications for my production ADFS service but not for my test ADFS service. Also, we took this route because as we add more support for monitoring AAD Connect(sync)/ADDS, the target audience for alerts for these will vary. If you think also would like a setting at the global level, do let us know. Also, don't forget to hit the 'Save' button on the command bar at the top of the blade when making changes.
- Clicking on an ‘Active’ or ‘Resolved’ alert will now take you to the Alert “Blade” which provides you details of the specific alert.
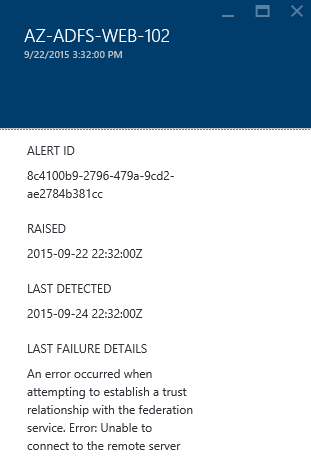
The Alert Blade
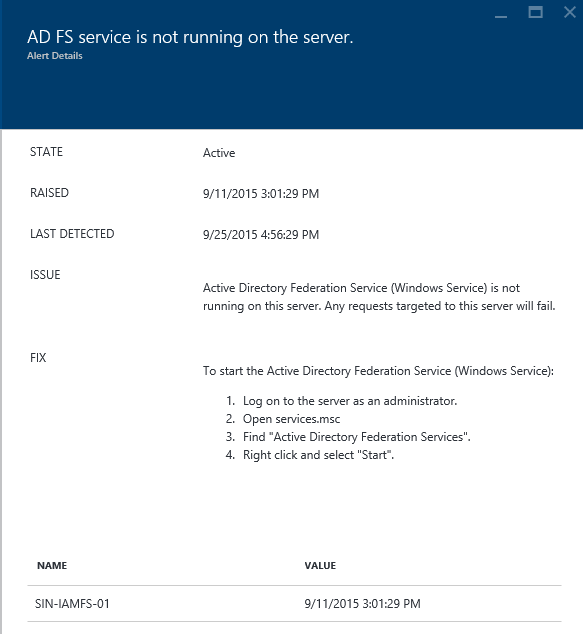
The purpose of the alert blade is to inform you on what the issue is, its inherent impact and more importantly tell you how to fix this.
Thing to know about this blade:
- ‘Raised’ & ‘Last Detected’ give you an indication of the length of an ongoing issue. If multiple servers are impacted, we use the earliest timestamp to indicate the time since you first started seeing the issue.
- ‘Issue’ tells you about the issue and where possible it’s impact. This way, as an admin, you clearly understand the impact and can prioritize resolving the issue based on the impact. In some cases, the issue can be due to more than one reason. We will list this out where possible.
- ‘Fix’ as it states is all about giving you instructions, on how to fix the issue. We try to be as prescriptive as possible so that it is easy for the admin to immediately know the instructions to fix this.
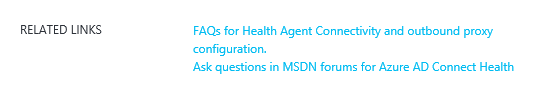
- In many cases, there is great content for you to learn or understand issues. We make this available for you right there with ‘Related Links’
Below this you will find additional data/details on the issue.
You will see the server(s)/service impacted and clicking on this provides the actual data that resulted in the alert. You can click to view this data. The data varies based on the alert and is quite self-explanatory!
How do alerts get raised?
Now that you under the elements of the alert experience, obvious questions that may come to your head are “how do these alerts get raised?” and “what data is used to raise these alerts”.
Alerts can be based on event log info, data returned by custom PSH scripts that are run by the monitoring agent (e.g. SSL binding info on a ADFS server, AAD relying party trust info in ADFS), performance data (e.g. CPU) and service related data (e.g. AAD trust info).
There are 3 types of alerts supported by the service
- A single data point that is received by the service (e.g. EventID==94)
- Multiple data points of the same type or of different types (e.g. EventID==94 && ADFS.AADRP == Disabled)
- Multiple data points of the same type across a time range (e.g. CPU)
How do alerts get resolved?
This is important to understand, especially for those used to SCOM. You don’t ever have to take an action to resolve an alert! Alerts are resolved in one of 2 ways:
- The conditions that were checked to raise the alert change in a more recent collection of the data, because you made a fix (e.g. the SSL certificate in ADFS servers were updated)
- In some cases, especially event log based alerts, we may not have a positive suppression event. In this case, we auto resolve the alert within a certain period of time. The current service level setting is 72 hours
Can I disable or add an alert?
Nope! The focus of the Connect Health service is to make it simple and ensure that we provide meaningful and impactful alerts. We think we can be smart about the alerts by using as much data as possible to get it right.
Of course, we may get it wrong. Do, let us know and we’ll certainly look to improve the alert trigger and its suppression.
In summary, this gives you more than you want to know about the alert system. If you have any questions/comments, drop us a line at the AAD forums, or leave a comment with this blog post or just tweet (@MrADFS)
Thanks
//Sam (@MrADFS)