Exploring Big Data: Course 2 - Analyzing and Visualizing Data with Power BI

(This is course #2 of my review of the Microsoft Professional Program in Big Data)
Course #2 of 10 - Analyzing and Visualizing Data with Power BI
Foreword: For the Analyzing and Visualizing Power BI course, I have asked my outstanding colleague Steve Taylor to share his experience recently completing the course. I originally took this course for the first time in December 2015 and since that time have worked almost exclusively with Power BI on customer sites. Steve and I thought that his perspective coming from a platforms background and being newer to Power BI would be a nice addition to the series.
Introduction : My name is Steve Taylor and I’m a Platforms PFE with Microsoft, who is pursuing data science as my IT side-hustle. Sam has asked me to review the two courses (Power BI and TSQL) that overlap between the MPP for Big Data and the MPP for Data Science, as I’ve taken both courses more recently than Sam’s pilot experience in the Data Science program. Given that I’m just breaking into the data side of things, I’ll bring a beginner’s perspective to these two courses.
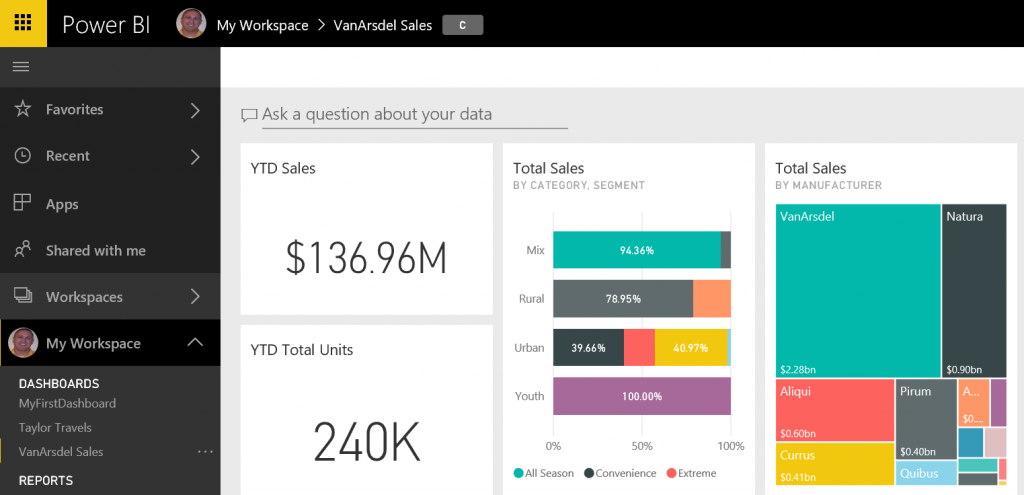
Overview : The course consists of ten modules, eight of which contain knowledge checks and labs. The syllabus walks you through using Power BI to connect to data, transform data, create models, and visualize the results. From there you start to use Power BI Desktop to interact with the Power BI service and use existing data models in Excel, Azure SQL, SQL Server Analysis Service, and other sources.
Time Spent / Level of Effort : Since I am pretty new to Power BI, this course took me about 7-8 hours to complete. There are just over 6 hours worth of videos in the course (when watched at 1.0x speed) and the remaining time was spent on the knowledge checks and labs. If you are already familiar with Power BI and Data Analysis Expressions (DAX), you could zip through the videos/quizzes/labs in a couple of hours.
Course Highlight : For someone who knew nothing more than “data visualization, right?” about Power BI, I found this course was a great overview of the breadth of possibilities within the tool. The course gave me just enough information about Power BI, DAX, and Power Query M that I’m confident enough to start trying to model and visualize more data sets, even if I know just enough to be dangerous and have to spend a lot of time on MSDN to get it just right.
Suggestions : For these edX courses, I look ahead to the data sets provided and try to follow along with the presenters in the videos (easier done when played at 1.0x speed). With both the videos and the labs, I found I was able to discover some Power BI features and capabilities by playing around with the data and visuals beyond what was discussed/asked for in the course specifically.
If you have taken this course in the past or are going through it now, please leave a comment and share your experience.
Many thanks to Steve for sharing his review of the Power BI course!
Thanks,
Sam Lester (MSFT)