Ask Learn
Preview
Ask Learn is an AI assistant that can answer questions, clarify concepts, and define terms using trusted Microsoft documentation.
Please sign in to use Ask Learn.
Sign inThis browser is no longer supported.
Upgrade to Microsoft Edge to take advantage of the latest features, security updates, and technical support.
Note
Access to this page requires authorization. You can try signing in or changing directories.
Access to this page requires authorization. You can try changing directories.

As part of my Power BI 12 Days of Dashboards series, day #9 will take a slight twist to the current format and help walk you through creating your first Power BI report leveraging data from System Center Configuration Manager (SCCM). I've also included the underlying data and full Power BI dashboard (.pbix) file as opposed to the pre-built templates as in the previous entries so you can explore how each visual is built based on the underlying data.
Over the past several years, I've probably written thousands of queries against the SCCM database, often creating and updating reports for customers for various data-driven reporting and automation projects. I've recently started getting requests from customers to help them learn Power BI based on their existing familiarity with the built-in SCCM reports.
To that end, the goal of this blog entry is to help you move from an existing TSQL query run against the SCCM database to a Power BI dashboard visualizing the results. This in no means intends to compete with the incredible Power BI SCCM dashboards that are available from the Power BI team here and from Raf Delgado through TechNet Gallery here. Both are very comprehensive and a spectacular starting point if you are looking for a pre-built SCCM dashboard.
Let's start with a simple TSQL query that we run against the SCCM database to obtain the counts of computer makes/manufacturers within the organization. A slight variation of this query can be found here.
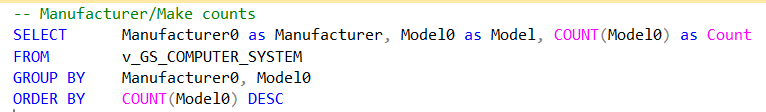
Query:
SELECT Manufacturer0 as Manufacturer, Model0 as Model, COUNT(Model0) as Count FROM v_GS_COMPUTER_SYSTEM GROUP BY Manufacturer0, Model0 ORDER BY COUNT(Model0) DESC
When we run this query in TSQL, we get the output in the SQL Server Management Studio results pane. You have a couple options for using this data as input to your Power BI report.
Now that we have our query results, we can build a small report based on the results. Here is an example based on sample data based on the above query:
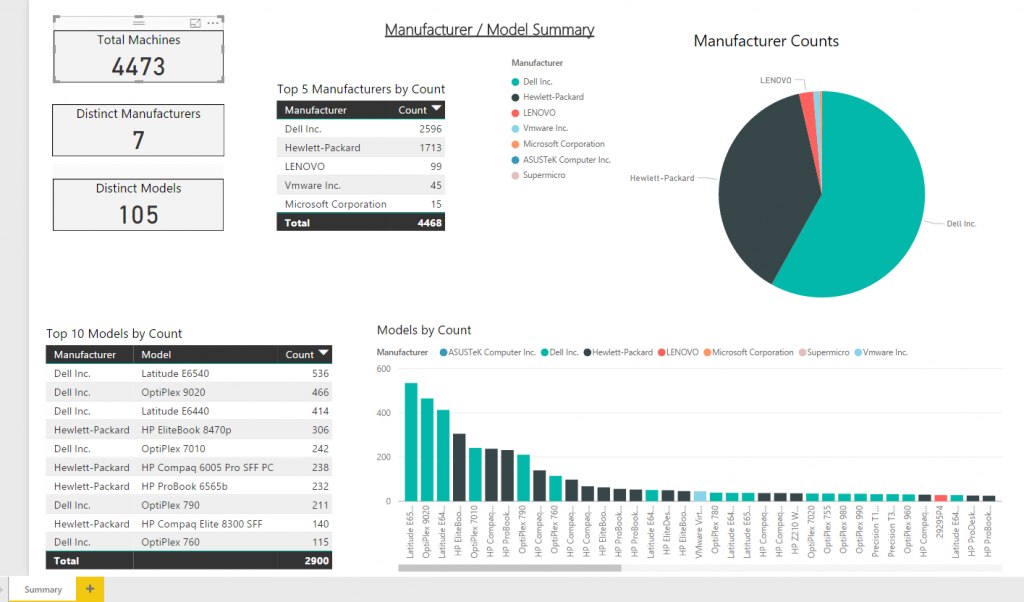
To explore this dashboard and the underlying data, download the Power BI .pbix file from here and explore each of the visuals. With this knowledge, you can easily extend to other SCCM queries and begin to build out dashboard and reports for the areas of the vast SCCM schema that is important to you and your organization.
Thanks,
Sam Lester (MSFT)
Ask Learn is an AI assistant that can answer questions, clarify concepts, and define terms using trusted Microsoft documentation.
Please sign in to use Ask Learn.
Sign in