Connecting SQL Server Profiler to Power BI Desktop
Connecting SQL Server Profiler to your Power BI Desktop Analysis Services Instance
One of my favorite methods of better understanding any database structure or application is to connect SQL Profiler and inspect the events being executed. Now that I've been using Power BI Desktop extensively over the past couple months, I have started to run Profiler in the background to help me associate the actions in the desktop application with the underlying DAX queries executed against the AS instance.
Since Power BI Desktop includes a child process running a local Analysis Services instance, we can determine the port on which it is running and use this to connect from Profiler. Thanks to Adam Saxton from the Power BI team for this handy tip!
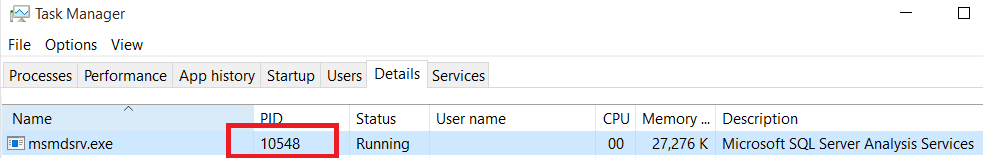
Step #1 - Get the process ID for the AS instance running as msmdsvr.exe from Task Manager:
Step #2 - Determine which port the process is running on. For this, I'll use the following netstat command from a command window:
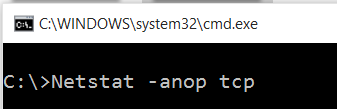
From the results, find the entry that includes the PID discovered in step #1 (10548 in this example). Once we discover this entry, we located the port number following the semicolon after the IP address. Below we see 127.0.0.1:38903, showing us that it is running on port 38903.

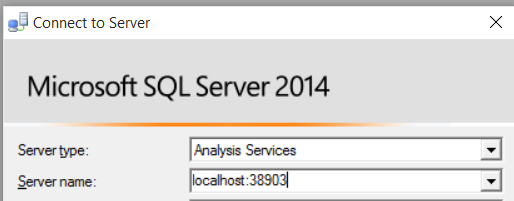
Step #3 - Connect to the AS instance with SQL Server Profiler - In this case, the server name will be localhost: followed by the port number discovered in step #2.
After connecting to our instance, we will begin to see the queries being executed. You can also use this to capture a trace for later investigation.
Hope it helps,
Sam Lester (MSFT)