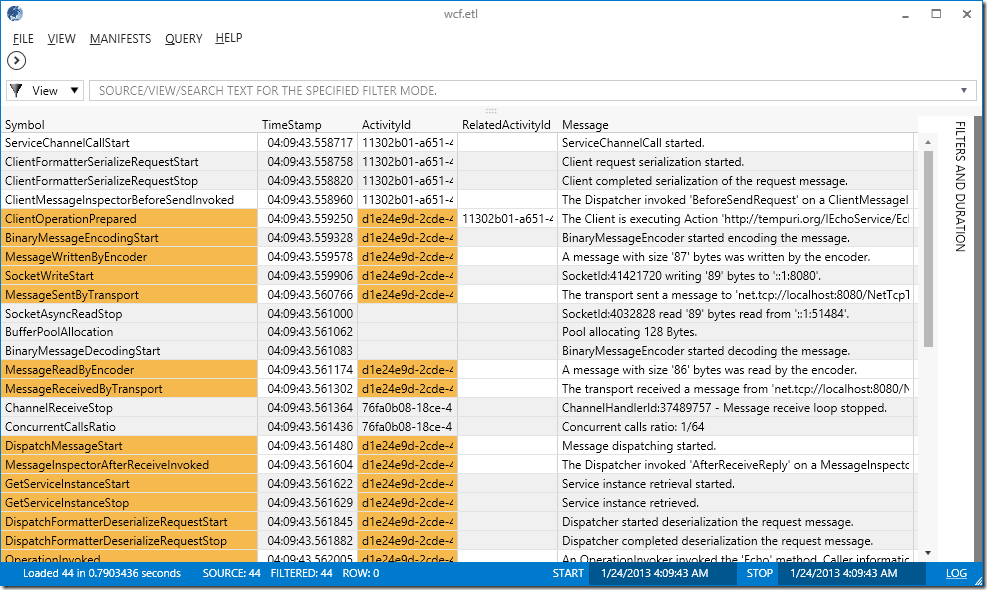
Sample ETW trace for WCF
You can see How do I collect an ETL trace for WF/WCF? for the commands or you can download the sample trace from here.
Open the trace using the following command line or File –> Open and load the manifest from the Framework folder or launch the following from the command line.
SvcPerf.exe wcf.etl %windir%\Microsoft.Net\Framework\v4.0.30319\Microsoft.Windows.ApplicationServer.Applications.45.man
Activity correlation can be obtained by clicking on the activity cell of the operation you are interested in as shown below and Ctrl+Shift+C should add a filter for the column you have chosen.
For more filters see – Filter in SvcPerf
