Javascript profiling in IE 8 beta 2
Great feature, new in beta 2 :-) Performance of the javascript engine has been a major focus for IE 8, and it also gives you the tools to ensure that the javascript on your site is optimised. By using the profiler you can figure out where you're spending most time.
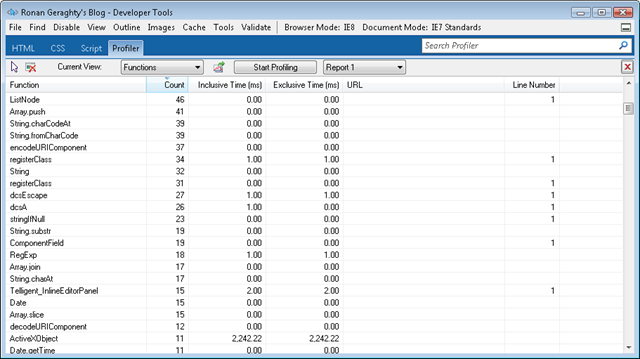
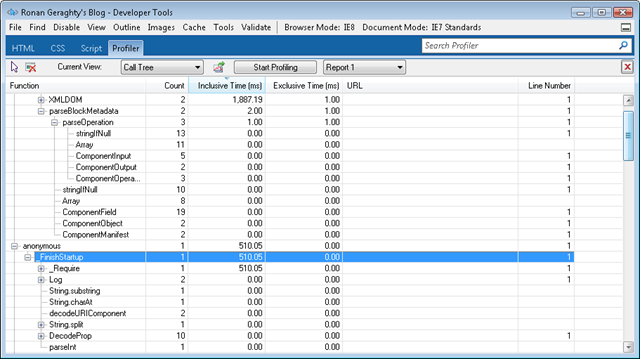
Below is a snapshot of a profiling session run against my blog's default page, in Functions view - within this view you can sort by e.g. Count (# times called), but I particularly like the Call Tree view so you can see the cumulative top-level time then drill down from there, (second screenshot below):