Creating DebugDiag 2 rule to generate SharePoint 2010-2016 process dump based on ULS Tags and Message
I had previously discussed this topic here but it would not work for ULS tags with 5 digits (SharePoint 2013 and beyond). This post will guide you to create the rule for this particular ULS log entry:
First, download DebugDiag 2 Update 2 or greater. As of the time of this writing it can be downloaded here.
In our proof-of-concept, or case study, we will generate a dump file only and only if the logged message has tag ai108 and contain “load XML” in the message like the row below:
| 05/04/2016 12:28:50.92 w3wp.exe (0x1C9C) 0x416C SharePoint Foundation Object Cache ai108 Medium Failed on try2 to load XML document at path 'C:\Program Files\Common Files\Microsoft Shared\Web Server Extensions\12\Template\Features\PowerViewStapling\feature.xml': System.IO.DirectoryNotFoundException: Could not find a part of the path (etc…) |
Steps:
1. Run DebugDiag 2 Collection
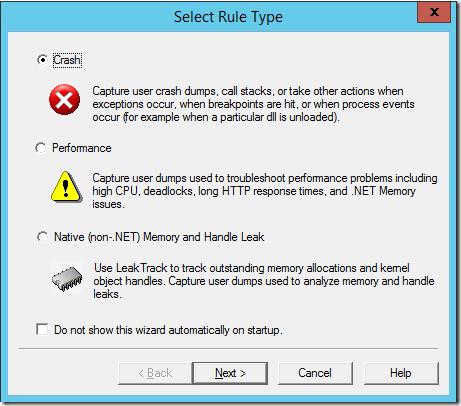
2. Choose crash rule and click Next
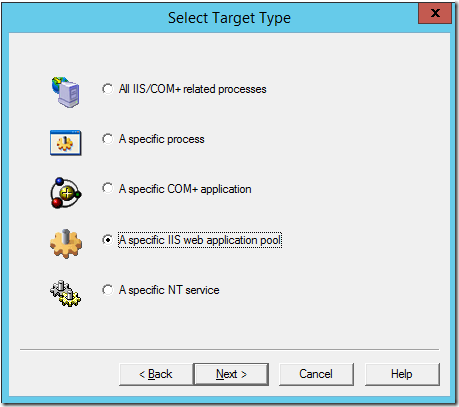
3. As I am capturing dump from a SharePoint web application I will choose “A specific IIS web application pool” and click Next. For Timer Services I would choose a specific NT service and then SharePoint Timer Service.
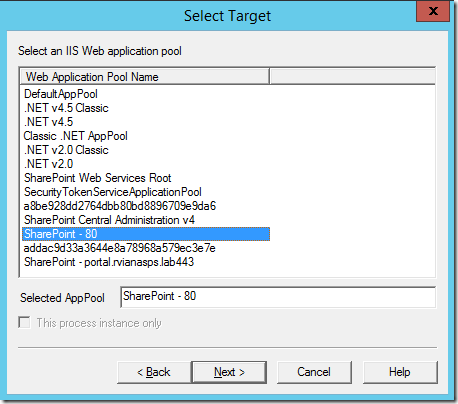
4. Then I will choose the application pool for the web application I want to capture the process dump (you can find the application pool name associated with the in Central Administration / Manage Web Applications) then click Next
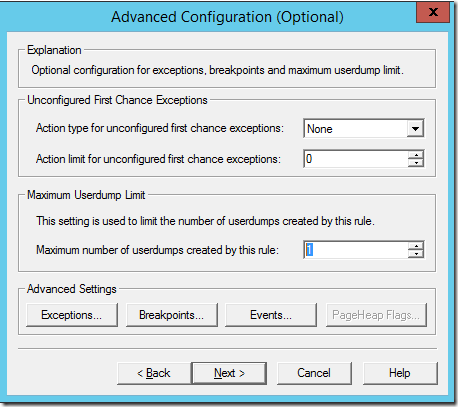
5. On Advanced Configuration, I will limit the number of dumps created by the rule to 1 (for a different requirement it can be a different number)
6. I will then click on the BreakPoints button
7. In configure breakpoint. click Add Breakpoint…
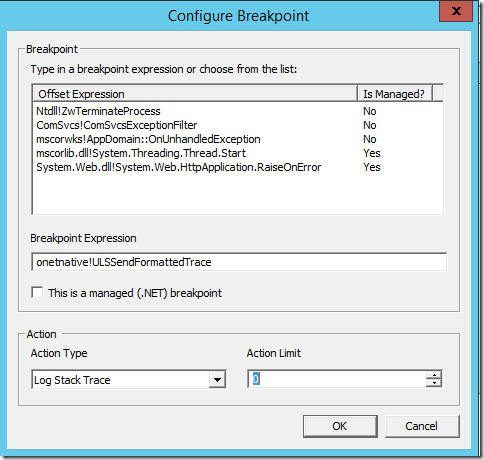
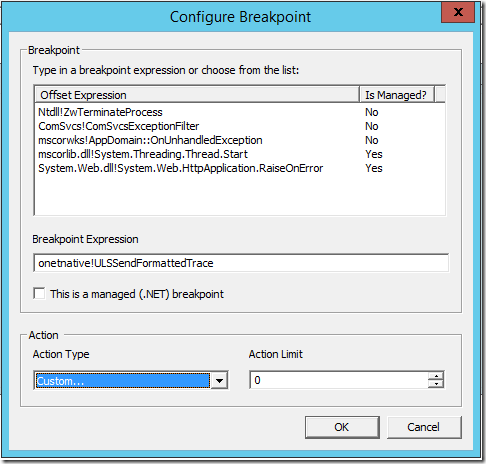
8. Enter onetnative!ULSSendFormattedTrace as Breakpoint Expression and Action Limit to 0 which means no limit:
9. On the Action Type dropdown, choose Custom…
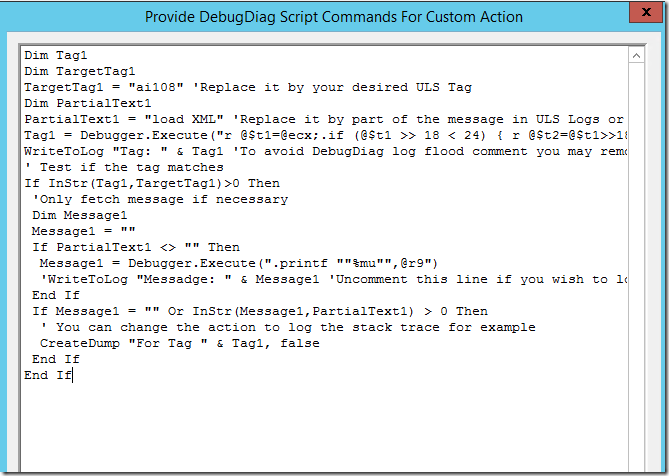
10. Replace the code in the window by this one:
Dim Tag1Dim TargetTag1TargetTag1 = "ai108" 'Replace it by your desired ULS TagDim PartialText1PartialText1 = "load XML" 'Replace it by part of the message in ULS Logs or make it "" for all messagesTag1 = Debugger.Execute("r @$t1=@ecx;.if (@$t1 >> 18 < 24) { r @$t2=@$t1>>18 & 3f; r @$t3=@$t1>>12 & 3f; r@$t4=@$t1>>0c & 3f; r @$t5=@$t1>>6 & 3f;r @$t6=@$t1 & 3f;.printf ""%C%C%C%C%C"",@@c++(@$t2 > 0x19 ? @$t2 + 0x16 : @$t2+'a'),@@c++(@$t3 > 0x19 ? @$t3 + 0x16 : @$t3+'a'),@@c++(@$t4 > 0x19 ? @$t4 + 0x16 : @$t4+'a'),@@c++(@$t5 > 0x19 ? @$t5 + 0x16 : @$t5+'a'),@@c++(@$t6 > 0x19 ? @$t6 + 0x16 : @$t6+'a');} .else { .printf ""%C%C%C%C"", @$t1>>18,@$t1>>10,@$t1>>8,@$t1; };")WriteToLog "Tag: " & Tag1 'To avoid DebugDiag log flood comment you may remove this line' Test if the tag matchesIf InStr(Tag1,TargetTag1)>0 Then'Only fetch message if necessaryDim Message1Message1 = ""If PartialText1 <> "" ThenMessage1 = Debugger.Execute(".printf ""%mu"",@r9")'WriteToLog "Messadge: " & Message1 'Uncomment this line if you wish to log the messageEnd IfIf Message1 = "" Or InStr(Message1,PartialText1) > 0 Then' You can change the action to log the stack trace for exampleCreateDump "For Tag " & Tag1, falseEnd IfEnd If
11. If it looks like it, press OK
12 If your window look like this, click Ok
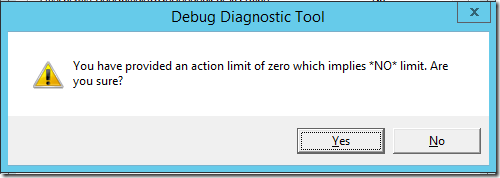
13. Click Yes to this warning
14. Click Add Breakpoint… again
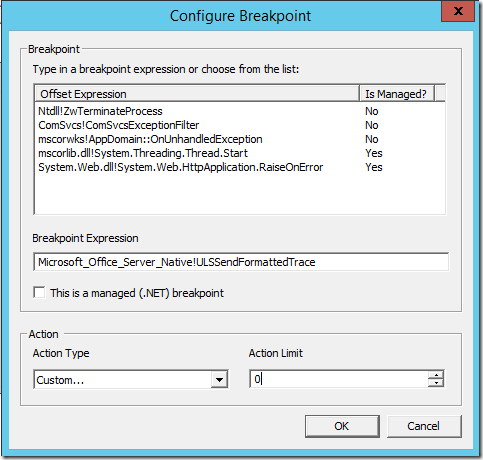
15. Enter Microsoft_Office_Server_Native!ULSSendFormattedTrace as Breakpoint Expression and Action Limit to 0 (no limit).
16. In Action Type dropdown, choose Custom…
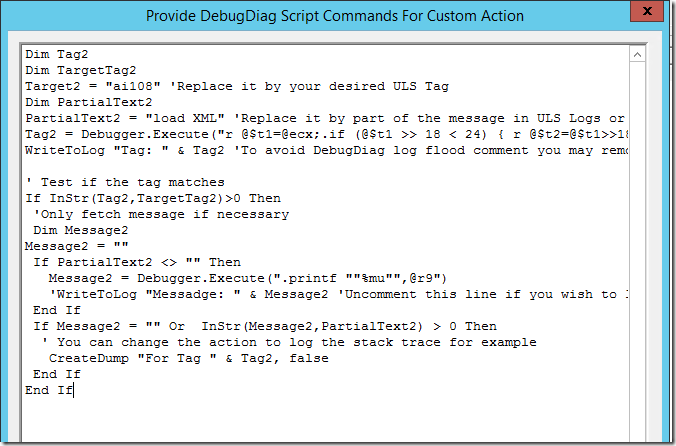
17. Replace the code in the window by this one:
Dim Tag2 Dim TargetTag2 TargetTag2 = "ai108" 'Replace it by your desired ULS Tag Dim PartialText2 PartialText2 = "load XML" 'Replace it by part of the message in ULS Logs or make it "" for all messages Tag2 = Debugger.Execute("r @$t1=@ecx;.if (@$t1 >> 18 < 24) { r @$t2=@$t1>>18 & 3f; r @$t3=@$t1>>12 & 3f; r@$t4=@$t1>>0c & 3f; r @$t5=@$t1>>6 & 3f;r @$t6=@$t1 & 3f;.printf ""%C%C%C%C%C"",@@c++(@$t2 > 0x19 ? @$t2 + 0x16 : @$t2+'a'),@@c++(@$t3 > 0x19 ? @$t3 + 0x16 : @$t3+'a'),@@c++(@$t4 > 0x19 ? @$t4 + 0x16 : @$t4+'a'),@@c++(@$t5 > 0x19 ? @$t5 + 0x16 : @$t5+'a'),@@c++(@$t6 > 0x19 ? @$t6 + 0x16 : @$t6+'a');} .else { .printf ""%C%C%C%C"", @$t1>>18,@$t1>>10,@$t1>>8,@$t1; };") WriteToLog "Tag: " & Tag2 'To avoid DebugDiag log flood comment you may remove this line ' Test if the tag matches If InStr(Tag2,TargetTag2)>0 Then 'Only fetch message if necessary Dim Message2 Message2 = "" If PartialText2 <> "" Then Message2 = Debugger.Execute(".printf ""%mu"",@r9") 'WriteToLog "Messadge: " & Message2 'Uncomment this line if you wish to log the message End If If Message2 = "" Or InStr(Message2,PartialText2) > 0 Then ' You can change the action to log the stack trace for example CreateDump "For Tag " & Tag2, false End If End If
18. If it looks like this you can click OK
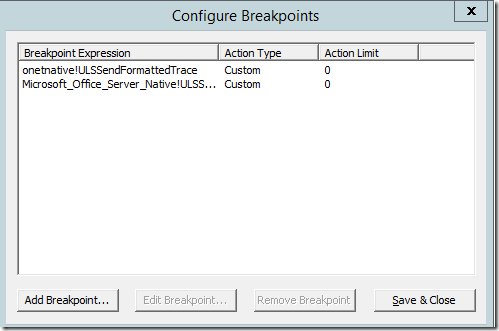
19. If things are correct, you should see this:
20. Click Ok
21. Click Yes to the warning
22. If you see this, click Save & Close:
23. If you see this you can click Next (notice that I changed the limit of dumps from 10 to 1):
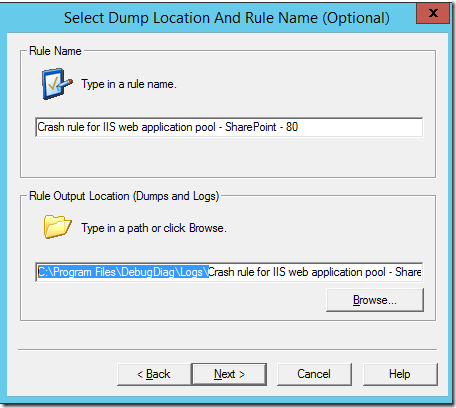
24. By default logs and dumps are saved at C:\Program Files\DebugDiag\Logs\. It is ok to keep the default, but some environments cannot hold big files on disk C:. To change the folder replace C:\Program Files\DebugDiag\Logs\ by your new disk folder (but please let the crash rule subfolder as it is). This is the moment to do so:
25. In my test, I replaced the folder to c:\temp (the folder does not need to exist)
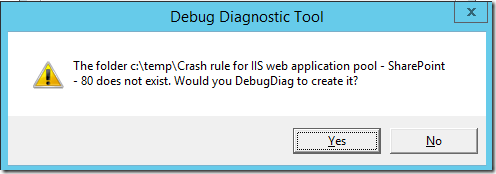
26. You may see this warning if the folder does not exist, just click Yes
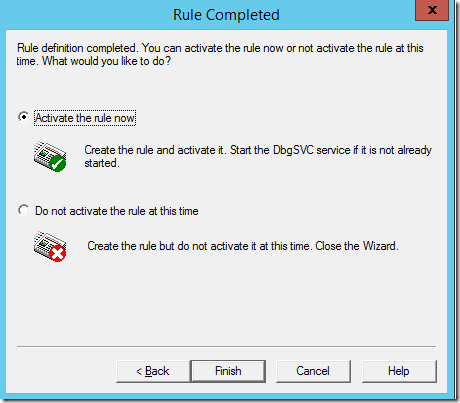
27. You can activate the rule now and click Finish
28. Now when it captures 1 dump file it will be marked as complete
