Using Group Variables in Reporting Services 2008 for Custom Aggregation
Introduction
SQL Server 2008 Reporting Services (SSRS 2008) features an on-demand report processing engine. This on-demand architecture has a number of key advantages over the processing engine design that existed in previous major releases. The most significant benefits are vast improvements to report engine scalability and performance (you can read a bit more about it here). Because of this fundamental change from previous versions, there are some specific design patterns that have changed. This post is a discussion of one scenario that, due to the new processing engine, requires a different design pattern in 2008 than was required in 2005 and 2000.
Special thanks to my esteemed colleagues Chris Baldwin and Chris Hays, who helped with the contents of this posting. Note: screenshots and how-to steps in this post are based on the currently available SQL Server 2008 RC0 release of Report Builder 2.0. Future releases of this product may change. The attachment at the bottom of this posting contains both, a 2005 version and a 2008 version of the final reports. The reports are based on the Northwind sample database (download link).
On-Demand Report Processing
The new processing engine in Reporting Services 2008 still retrieves datasets upfront, but only pre-computes certain invariants, such as grouping, sorting, filter expressions, aggregates, subreport parameters and queries. Everything else are "on-demand" evaluated expressions; most notably, textbox values, and style expressions.
Furthermore, the processing engine now exposes a cursor-based report structure as so-called RenderingObjectModel. Rendering extensions, responsible for translating the processed report to the desired output format, traverse the report using a hierarchy of RenderingObjectModel cursors. This is in contrast to the processing engine in 2005 and 2000 in which the entire report was fully processed upfront. A couple implications of this on-demand model are that
a) objects are evaluated hierarchically throughout the report,
b) hidden textboxes are not evaluated, and
c) the concept of Report and Group Variables has been introduced
Report and Group Variables
In Reporting Services 2008 / RDL 2008/01 namespace, one can declare variables that are global throughout the report or local to particular group scopes and refer to them in expressions. Report and group variables can only be set/initialized once and have a read-only semantics.
Typical use cases for variables include:
- Caching values:
Report/group variables can be used to make an expensive call to an external assembly once, cache the result, and then reference the variable value from other expressions in the report. - Time-dependent calculations:
For example, retrieve a currency conversion value and store it in a report/group variable to be applied consistently during the lifetime of the rendering session. - Specific execution-order semantics:
Achieve particular expression execution order semantics that is independent of the rendering extension used later for generating the report output.
The latter use case of group variables will be discussed in more detail in the remainder of this blog posting to implement custom aggregation in a Reporting Services 2008 report.
Custom Aggregate Scenario
The scenario discussed is one where a report author implements a custom aggregate, illustrated by an implementation of a Median function.
A common pattern for implementing a custom aggregate such as Median in Reporting Services 2005 is like this.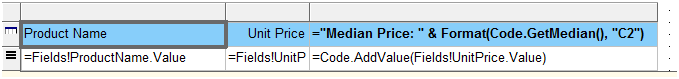
With the custom code for GetMedian and AddValue as follows:
Dim values As System.Collections.ArrayList
Function AddValue(ByVal newValue As Decimal)
If (values Is Nothing) Then
values = New System.Collections.ArrayList()
End If
values.Add(newValue)
End Function
Function GetMedian() As Decimal
Dim count As Integer = values.Count
If (count > 0) Then
values.Sort()
GetMedian = values(count / 2)
End If
End Function
What happens here in SSRS 2005 is that for each instance of the detail row, the value gets passed to AddValue() and then added to the values ArrayList. A textbox in the Table header, then, makes a call to GetMedian() which performs a calculation on the values in the ArrayList, and displays it.
It's important to note that this wasn't exactly supported in SSRS 2005 and it wouldn't even work properly in most cases. For example, if you were to add end-user sorting to the table, then the processing would go through a different code path that would evaluate the headers before the details. This would mean that the GetMedian() function would be called before AddValue has a chance to add any values are added to the ArrayList. It just so happens that in this particular case, when there is no end-user sort, the details are processed first.
Whether or not it was officially supported, a number of people got this to work and are relying on this behavior. In order for the same pattern to work in SSRS 2008, the report needs to be slightly redesigned. Detailed, step-by-step, instructions are provided below. Note that the pattern of using group variables outlined below is not limited to custom aggregation, but can be expanded into more complex solutions. We can show you the path and the pattern, but you will have to apply it to your unique situation. YMMV (your mileage may vary).
Implementing this in SSRS 2008: Step-by-Step
The report needs to be slightly revamped in 2008 in order for this to work. The custom code itself, however, doesn't have to change at all. This is going to be a step-by-step procedure by which you can port this pattern from your 2005 report to 2008. Note that the attachment at the bottom of this post contains a 2005 report and a 2008 report, both implementating this custom aggregation approach.
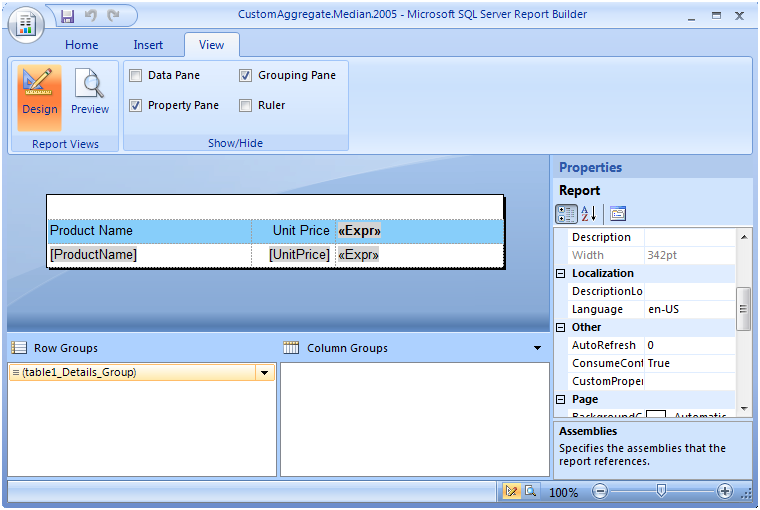
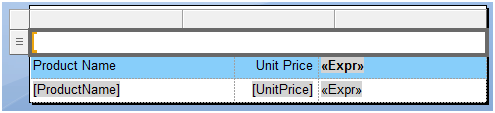
Open the report in Business Intelligence Development Studio (BIDS) 2008 or Report Builder 2.0. When you open the 2005 report in a 2008-based tool, the RDL schema will be automatically upgraded to 2008. This is what you'll see in Report Builder 2.0:
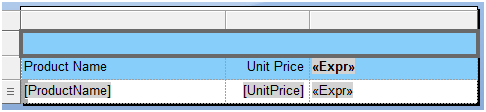
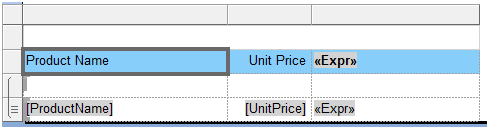
In on-demand processing, items are generally evaluated from the top-down. This means that in order to add the values of your detail rows into the ArrayList from which you will calculate the Median value, you need to add a "dummy" tablix to your report with its own detail row. This row can be hidden, as it's used solely for calculation purposes. Specifically, its purpose is to make calls to the AddValue function to populate the ArrayList. So that this table can "share" values with the table that will be visually presented in the report, it they both need to be part of the same table. Add a single static row above the header row in the table. Right-click in the blue Product Name cell, and select Insert Row > Above. In the newly inserted row, merge all of the cells. This is what you should see:
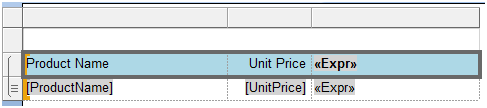
Click the new cell (as shown above), and from the Insert tab on the Ribbon, select Table. Delete the top row from the newly created table, and merge the cells together:
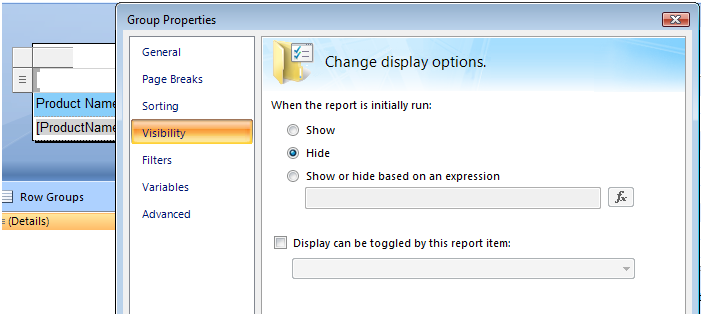
Select the detail group for this new inner table, and set the Hidden property to True. Since this is used only for calculations, it doesn't need to be visible in the rendered output of the report:
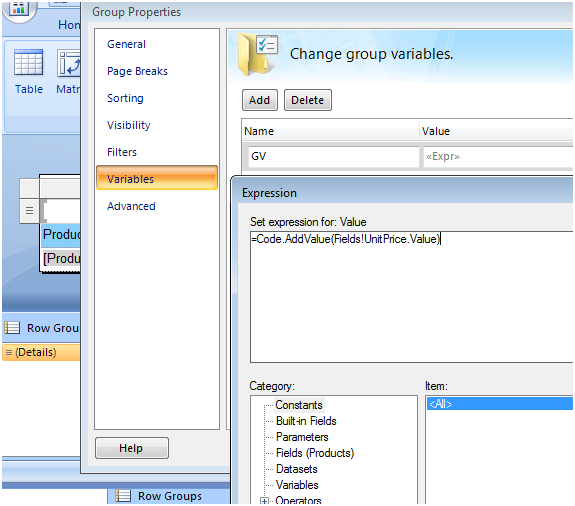
Now, you need to add the call to the AddValues function within the context of the nested table. As I mentioned above, a hidden textbox's value will not be evaluated due to the new on-demand processing architecture. In order to make sure the call to AddValues is made regardless of the visibility of the group, add it as a group Variable:
The original rows of the table need to be slightly restructured so that the original row functions as a group header.
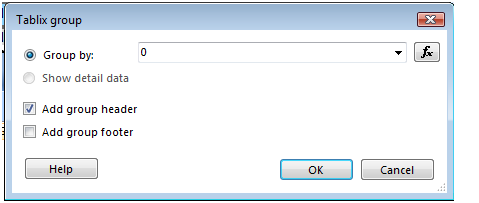
Step 1: Right click in the Product Name cell and select Add Group > Row group > Parent group
Step 2: In the Tablix group dialog: Group by: 0 (constant value); Select Add Group header
Select the newly created group header textbox (with the 0 in it), right click, and select delete column. You should then have this:
Copy the contents of the blue cells into the row below it, so that it's inside the group. Then, delete the row from which the values were copied. Re-add the blue background to the other row if you want. Now you should have this:
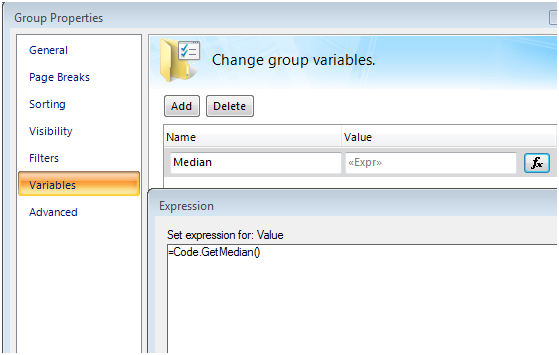
Now, in order to properly retrieve the calculated Median value, you need to add the call to GetMedian into a group Variable for the group that contains the header where you want to value to be displayed. Select the group from the grouping pane, and add this group Variable: