Getting LightSwitch Web App Memory Dumps and so much more using KUDU
There’s an nice little diagnostic tool that is available for all Windows Azure Web Sites that I came across called KUDU.
KUDU is one of those neat little things that is developed here at Microsoft that I seem to just accidentally stumble into (like SignalR).
So in this blog, I’m going to give a brief demo of how you can use the KUDU diagnostic service with your own LightSwitch Web Apps that is deployed to a Windows Azure Web Site. But truthfully, you could use this with any azure web site (not just LightSwitch).
If you are someone who loves having debugging tools at your disposal like, KUDU, and you use Azure Web Sites, then this blog is for you :).
Publish a LightSwitch Web App to an Azure Web Sites
I won’t be going over how to publish a LightSwitch app to an Azure Web Site since there are already so many walkthroughs on how to do this (like this one - How to: Publish a LightSwitch Application to Windows Azure). But you will need to get this step done before we can continue. If you already have a recent deployment, then we can use that too.
Launch the Azure Portal and navigate to your Azure Web Site. You should see an option to “Set up deployment credentials” (unless you have already done this in the past, in which case you should have these credentials setup already).
Go ahead and click this link. Then setup your login and password. The KUDU service requires credentials before you can use it, and it’s going to use these credentials that you just setup.
Check out the KUDU Service
We’ll get to collecting a memory dump from our web site in a minute, but first let’s just look at the KUDU service some more.
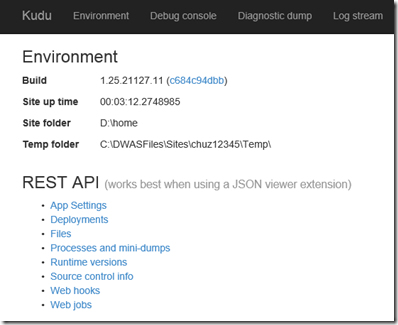
The KUDU service has something like a “Dashboard” that you can access (with your credentials): https://”mywebsitename”.scm.azurewebsites.net
The dashboard looks like this:
There’s some information on how to use the REST API (which we’ll do later on), and at the top there are some other functions, like “Debug Console”. Which is very cool IMO.
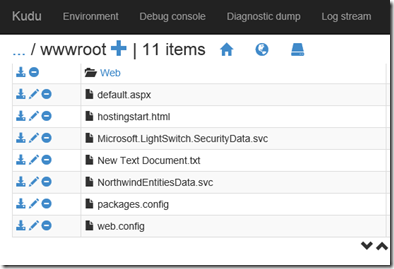
If you select Debug Console and then click the Sites folder, you’ll see something like this:
These are the web app’s files on some machine up in the “cloud”. All the files you published are up here.
I fell out of my seat with excitement when I first saw this. You can do some great stuff here like edit the web.config file (to do something like enabling tracing), or add new files (as I have done with the cleverly named “New Text Document.txt”). You could do these things before of course through other methods, but this streamlines the whole experience and makes it more familiar to use.
Get a Memory Dump
We will now use the KUDU Service to get ourselves a dump of the process that hosts our web application. All the different ways to get various types of process DUMP files are documented on the KUDU GitHub site. Remember any requests you make are going to be counted as part of your usage quota for your Azure Subscription. The one we are going to get is a GCDUMP, which is a memory dump and something we can look at using VS 2013 Ultimate.
Launch a PowerShell script. And input the following script call to the KUDU service to retrieve the first process (i.e. w3wp.exe) and get a GCDUMP of it:
Invoke-WebRequest -uri https://<Website>.scm.azurewebsites.net/diagnostics/processes/0/gcdump
-credential <YourDeploymentUser> -outfile .\dump.diagsession
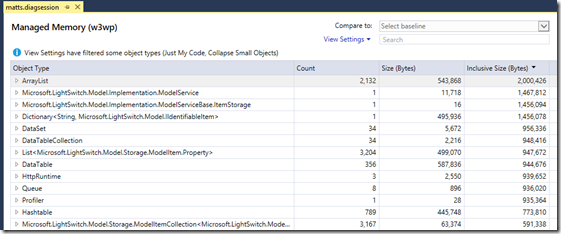
We are writing a dump.diagsession file as the output from this call. When you open it in VS it should look something like: 
Which is a very nice low level view of the memory usage by our application. You could dig down into it at this point and figure out where most of your memory usage is going.
THAT IS IT
I hope that opens up your world to another diagnostic tool you could use to debug your LightSwitch Azure Web Site.
Thanks for reading. You all rock. Have a good code! – Matt Sampson
Follow me on Twitter - https://twitter.com/TrampSansTom


