.Net contention scenario using PerfView
This is a contention case study from one of our ATs - I have been learning a lot about PerfView from one of our more experienced devs, once you get a grip of it, you can do amazing things with perfview.
The perfview was collected using this command (which tells it to collect a perfview once contention CPU exceeds 90%
perfview collect /merge /zip /AcceptEULA "/StopOnPerfCounter=Processor:% Processor Time:_Total>90" /nogui /NoNGenRundown /DelayAfterTriggerSec=30
Once perfview was collected, we followed these steps:
1- Open etl file with perf view
2- Double click on CPU stacks
3- Select the process you want to investigate (w3wp, waworkerhost,…)
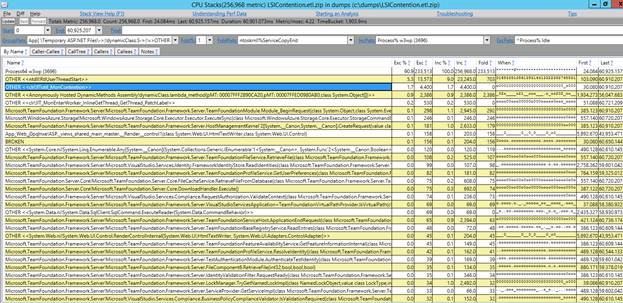
4- Clear Fold% and enter, then select all and choose Lookup Symbols
5- Search for clr!JITutil_MonContention – look for the inclusive % - in this case it is 45% which means there is a significant amount of contention going on
6- Double click on this row, it will show you the stacks where contention is happening -
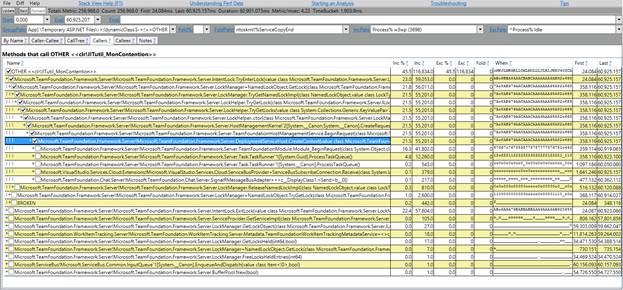
7- To Dig deeper use the below steps to get additional details on what the threads were doing at the time of the contention.
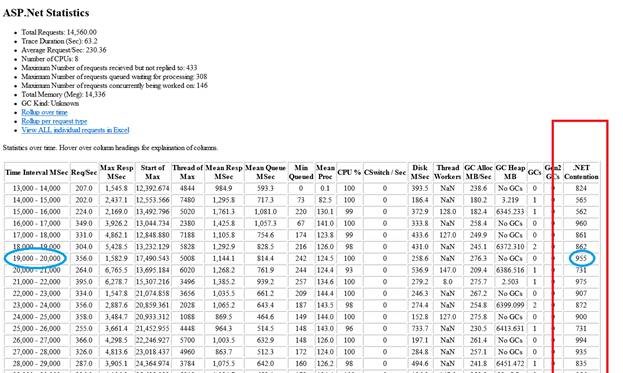
8- Go back to PerfView main window, double click on ASP.Net stats
9- Pick the interval with highest contention, in this case they are all just as bad, so we picked (19,000 to 20,000)
10- Go back to PerfView main window
11- Double click on events
12- Filter by contention events (see screenshot) and press enter to refresh.
13- Filter by the start and end of the interval you got in step 9
14- Double click on Columns to Display and Choose ThreadID, then sort data by Thread ID
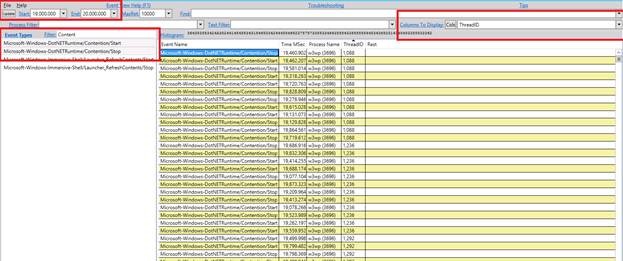
15- Pick the thread with the most contention events (e.g. 3232)
16- Select the row
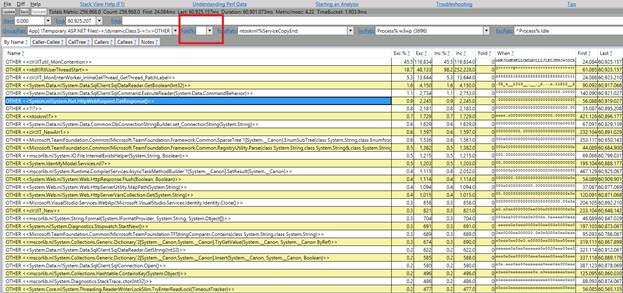
17- Press ALT + S (or right click and choose Open any stacks) – this will set the time filter for you to 19000 - 20000
18- Search for the thread ID you are interested in
19- Select the row containing the thread and Press ALT + I (isolate)
20- You will see all the stacks for this thread at the time where it had the issue
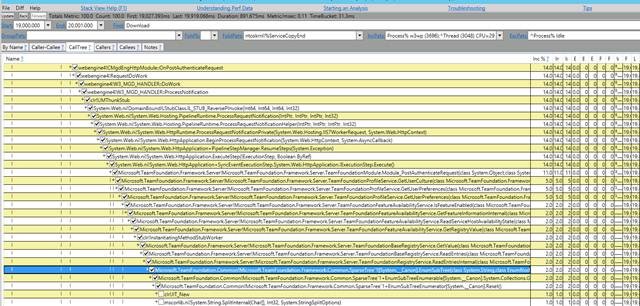
Now you know exactly when the contention happened, how much CPU it was using, which threads caused most contention, and what exactly your threads were doing right before the contention.