WCF Instancing, Concurrency, and Throttling – Part 3
In part 1 and 2, I talked about instancing and concurrency. In this post, the 3rd and final post on this subject, I’m going to show an example of how you can use throttling to achieve optimal throughput for a service. But first…
What is throttling?
Throttling is a way for you to limit (“throttle”) the throughput of your service so that resources (memory, CPU, network, etc.) are kept at healthy levels. How you throttle a service will depend largely on the resources a particular machine has. For example, a service deployed to a machine with 1 processor, 2G RAM, and Fast Ethernet would be throttled less aggressively if deployed to a machine with 4 processors, 16G RAM, and Gigabit Ethernet.
How is throttling achieved?
In WCF, throttling is achieved by applying the ServiceThrottlingBehavior to the service. This service behavior provides 3 knobs (MaxConcurrentCalls, MaxConcurrentInstances, MaxConcurrentSessions) that can be dialed up/down. I’m going to assume you are already familiar with these. If not, then please review these links before proceeding.
For this topic of discussion, I’m going to use the same service I described in part 2, which simulated some long-running work by sleeping for 5 seconds. The service is PerCall/Multiple Concurrency and hosted in a console application with one endpoint using WsHttpBinding default settings. I’m also going to be using the load testing tools that are part of the Visual Studio Test Edition to see how my throttling adjustments impact the throughput of the service. My test harness is going to simulate 100 concurrent users using a constant load pattern for a period of 1 minute. Each simulated user will instantiate a proxy to the service and then proceed to call the service repeatedly using that proxy. In other words, I’m not incurring the overhead of recreating the client proxy and re-negotiating the security context for each and every call. I’m only incurring this overhead once for each of the 100 users.
Load Test 2 |
Throttle Settings |
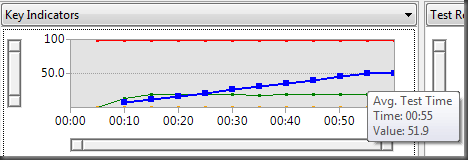
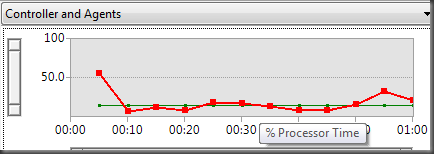
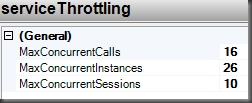
ConclusionSome improvement. 1. Total tests increased from 106 to 164. 2. Average test time improved from 32.4 seconds to 26.9 seconds. Still, for a service call that should take just over 5 seconds, this is unacceptable. Our goal is to get this number as close as possible to 5 seconds. 3. The average test time is still growing. 4. The processor is still not working very hard. Interestingly though, our processor did level out nicely on this run as compared to the last run. This mainly has to do with the fact that the overhead of establishing the security context for all users was incurred at the beginning of the test, which is why you see the first recording of processor time being higher (about 75%) in this run. What these results show is that we’re being limited by the number of concurrent calls (16) our service allows. Yes, we’re allowing 100 users at a time through the channel layer. However, only 16 users are getting their calls serviced because we’re limited to 16 concurrent calls. MaxConcurrentInstances does not apply in this case because for PerCall services, WCF will take the lower of MaxConcurrentCalls and MaxConcurrentInstances and use that number for both. So, doing the math of 16 users making approximately 10.x calls per 60 second period, our result of 164 total tests makes sense. Since memory and processor are extremely low, I’ll bump these settings up to 100 each and rerun the test. |
Load Test 3 |
Throttle Settings |
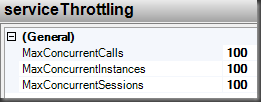
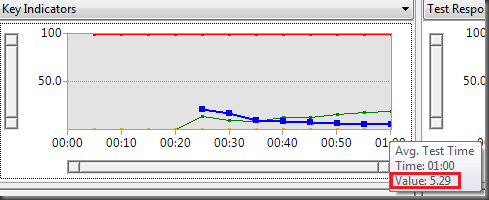
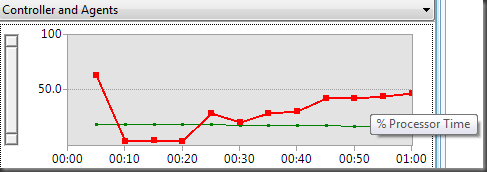
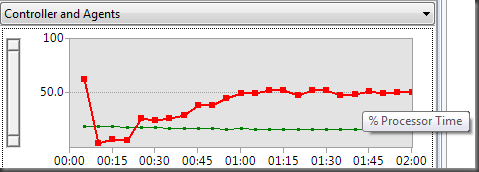
ConclusionMuch better performance on this run. 1. Total tests increased from 164 to 571. 2. Average test time improved from 26.9 seconds to 9.92 seconds. 3. The average test time is now trending downward. In fact, the last recording at the 1 minute mark showed an average test time of 5.29 seconds. 4. The processor is doing much more. However, it stays well below 50% for most of the test. I’m much more pleased with these results. We’re getting a lot more throughput with these settings. You have to look more at the numbers near the end of the test to realize this because of the overhead we’re experiencing of 100 users all hitting the service at exactly the same time. However, once things get going the indicators start to level off nicely. Or do they? Looking at the processor it looks like it is growing. I suspect it is because of the short duration of the test though. So, I reran the test again for a period of 2 minutes just to verify that it didn’t continue to grow. Here’s the results of that test run. Suspicion verified - I’m satisfied with that! Not only does the processor level off nicely at about 50%, but as you should expect, my Average Test Time improved from 9.92 seconds to 6.77 seconds. |
Final Thoughts
The purpose here was simply to show how you can influence the throughput of your service by making some simple throttling adjustments. Every service will be different though and the use cases for each application load test will be unique. So, don’t assume these settings would work the same for your service. Also, my test scenario was very basic – constant load and repeated synchronous calls from the client. It might be more realistic to have a step up pattern whereby the number of users increased gradually up to 100. It might also be more likely to have some think times in between each call to the service. I also ran all this on one machine which is not typically representative of a production environment. The point is, when you are trying to determine your throughput, you need to consider a specific use case and then configure your test settings accordingly.
The last thing I want to mention is that my test harness did not simulate a multi-threaded client. Yet, my service is capable of multiple concurrency. If I were to change the test to simulate a multi-threaded client where the client makes 2 concurrent calls on different threads, what throttling settings would you need to adjust? The answer is MaxConcurrentCalls and MaxConcurrentInstances. You would need to increase these to 200 to allow all 100 users to make 2 concurrent calls. Of course, you would also want to test this to see if you get the results you expect and that your processor load stays healthy. If not, you can “throttle” these back a bit until you reach the numbers you want.

