The case of the stunted recovery
We had a very rough first week of September, here at Azure DevOps (formerly known as Visual Studio Team Services), you can read more about it here that we were having a bad couple of days in the Azure South Central region after a bad storm.
We had finally recovered (or so we thought) when we realized that one of the two big TFS scale units was showing signs of distress:
Availability was down sharply:
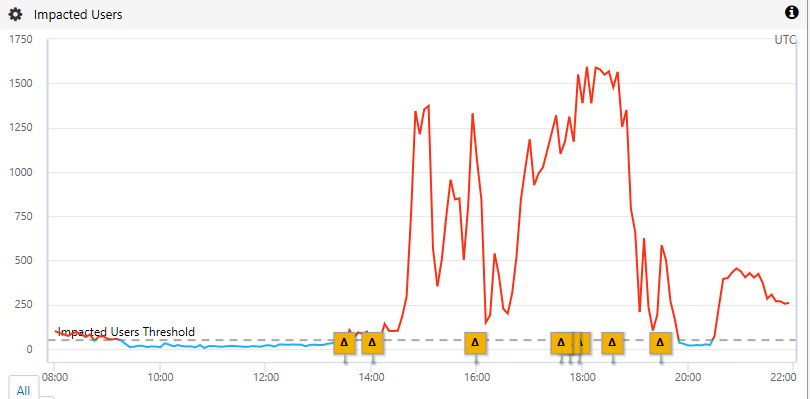
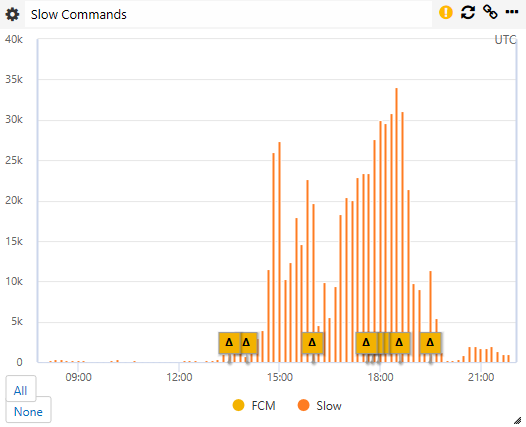
Mostly because of slow commands (as opposed to just failures):
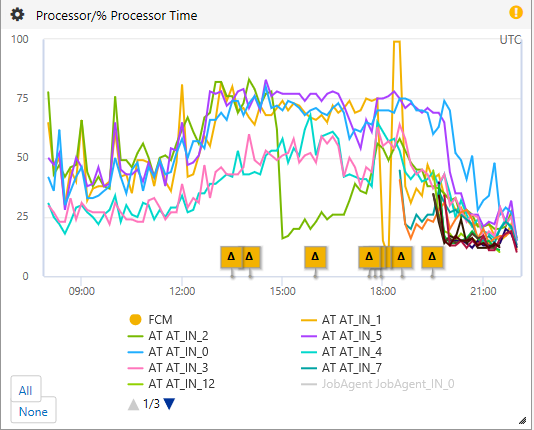
CPU was high but not high enough to explain such performance problems (note that I am writing this after the fact so you see the recovery around 19:00) - you'll also notice the fact that we recycled AT_IN_2 and got a memory dump on AT_IN_1):
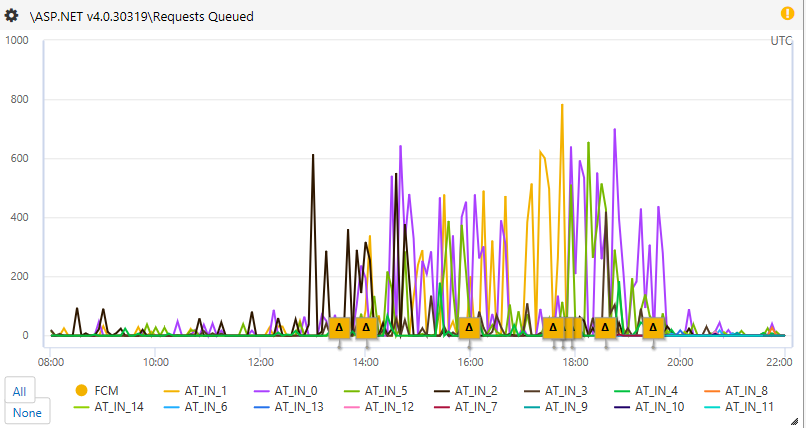
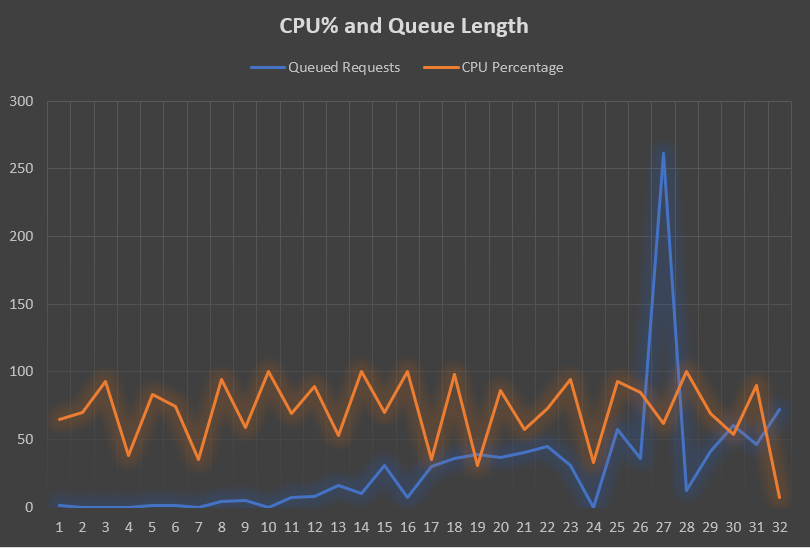
And Queued Requests were high (not a good sign, consistent with performance issues):
So the next step is to go look at a PerfView log (which our automated agent grabs for us in those cases).
In the case of High Requests Queued, I also start with the ASP.net statistics node:
ASP.Net Statistics • Total Requests: 8,926.00 • Trace Duration (Sec): 169.0 • Average Request/Sec: 52.80 • Number of CPUs: 20 • Maximum Number of requests recieved but not replied to: 1165 • Maximum Number of requests queued waiting for processing: 749 • Maximum Number of requests concurrently being worked on: 955
Those numbers are pathetic (given the D15v2 machine we're running), we can usually push 800+ requests/sec with this kind of hardware – in this case, we’re barely doing 52…
I also notice a weird pattern: the CPU is all over the place, and the queueing seems to be happening when the CPU is low:
One known way to get this kind of pattern is excessive GCs which may cause beat frequency issues, so naturally, I look at the GC Stats section, and I see this:
• CommandLine: d:\windows\system32\inetsrv\w3wp.exe • Total CPU Time: 420,750 msec • Total GC CPU Time: 24,694 msec • Total GC Pause: 13,354.6 msec • % Time paused for Garbage Collection: 48.9% • % CPU Time spent Garbage Collecting: 5.9% • Max GC Heap Size: 97,452.790 MB • Peak Process Working Set: 105,898.787 MB • Peak Virtual Memory Usage: 2,339,444.720 MB
So what I see is:
• We’re using a lot of CPU overall (420s/30s = 14 cores out of 20) but it’s not atrocious
• We’re not spending a lot of CPU in the GC (5.9% is good)
• We’re spending close to half of the time paused (48.9%) and clearly not doing much since the CPU in GC is 5.9%!
So the next thing to look at is why we’re spending so much time suspended so I look for a long pause and focus on that:
GC Index Pause Start Trigger Reason Gen Suspend Msec Pause Msec 32952 3,773.61 AllocSmall 1N 1,304.97 1,582.67 • GC Index is just the # of the current GC, it’s the 32,952th GC for this process • Pause Start is when the CLR starts the suspension • Trigger Reason is why the GC was triggered (by a small allocation) • Gen is the Generation • Suspend Msec is how long in milliseconds the suspension took (way too long!) • Pause Msec is the total length of the pause
What I am looking for now is why it’s taking so long to suspend the Execution Engine (EE) – and the way to do that is to see what is actually running while we’re supposed to be pausing.
Here are the events I am interested in:

So I go to the CPU view, pick my process (w3wp) and restrict the timeline to between the events above:
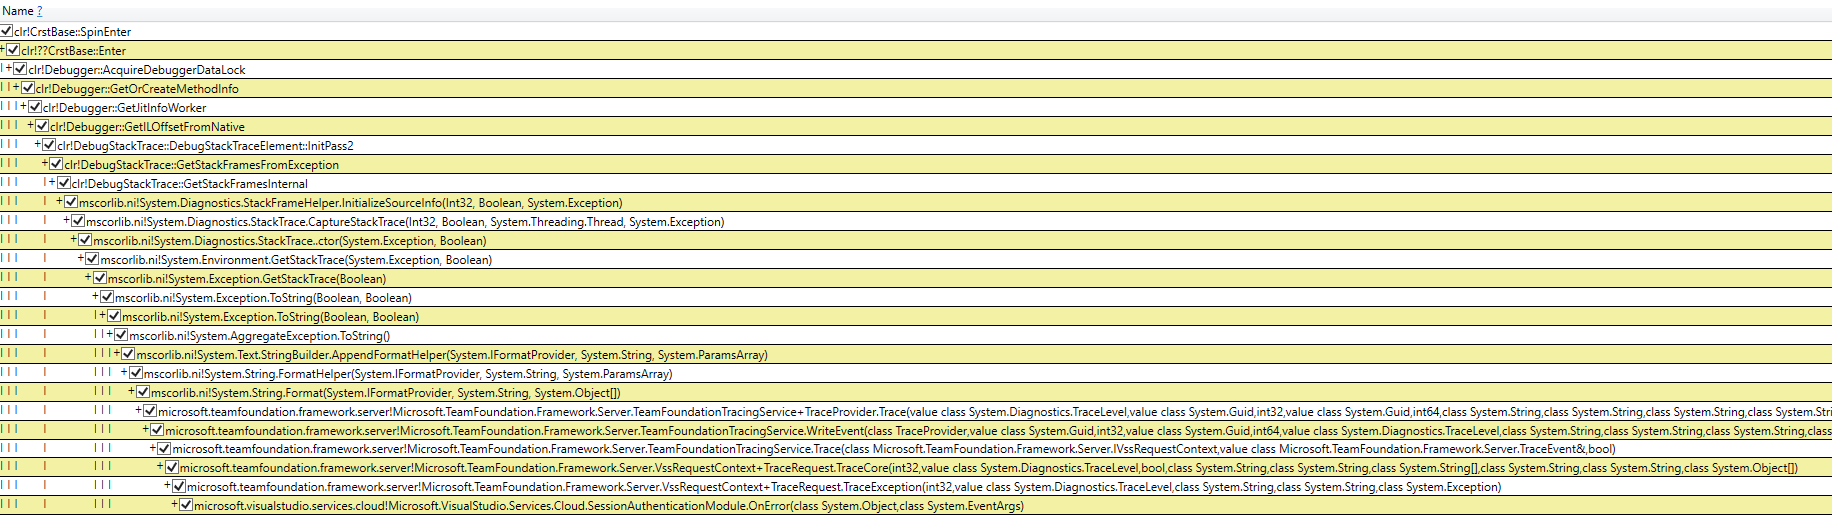
I observe this weird pattern of contention on a native CLR lock while we’re gathering a stack trace while printing Exception.ToString() – so I call my colleagues and they tell me they don’t see any traces showing this exception and that I must be mistaken… I have to agree with them that we indeed don’t see any of those traces so we’re kind of stuck – still, I share my findings with the CLR perf folks and figure they probably know better.
In the meantime, I grab a dump of the process (111 GB) and look for large objects (the process is really bloated and since I am investigating GC issues, it seems like a good idea) – I notice a lot of large strings in the LOH:
0:272> !DumpHeap -min 81000 -MT 00007fff4e176830 Address MT Size 000002f8791bb080 00007fff4e176830 4362836 000002f8798540f8 00007fff4e176830 4431142 000002f87f326c58 00007fff4e176830 4431358 0000030101531c18 00007fff4e176830 5026698 000003010273ecd8 00007fff4e176830 4430314 0000030103f9f838 00007fff4e176830 4434006 00000301083defc0 00007fff4e176830 5026698 000003010cd7ab80 00007fff4e176830 5027526 000003010de528c0 00007fff4e176830 4360256 000003010e4d93b0 00007fff4e176830 4363424 000003010f93e598 00007fff4e176830 5027526 0000030166df1020 00007fff4e176830 10058324 …
So I dump one of those strings, and then another, and another and they all look like this:
0:000> !do 0000030166df1020 Name: System.String MethodTable: 00007fff4e176830 EEClass: 00007fff4da56cb8 Size: 10,058,324(0x997a54) bytes String: Fields: MT Field Offset Type VT Attr Value Name 00007fff4e179180 4000273 8 System.Int32 1 instance 5,029,149 m_stringLength 00007fff4e1779e8 4000274 c System.Char 1 instance 53 m_firstChar 0:000> du 0000030166df1020+c 00000301`66df102c "System.AggregateException: One o" 00000301`66df106c "r more errors occurred. ---> Mic" 00000301`66df10ac "rosoft.ServiceBus.Messaging.Mess" 00000301`66df10ec "agingException: The service was " 00000301`66df112c "unable to process the request; p" 00000301`66df116c "lease retry the operation. For m" 00000301`66df11ac "ore information on exception typ" 00000301`66df11ec "es and proper exception handling" 00000301`66df122c ", please refer to https://go.micr" 00000301`66df126c "osoft.com/fwlink/?LinkId=761101 " 00000301`66df12ac "TrackingId:b8337bc1bb0d4f26909e4" 00000301`66df12ec "a73054ae986_G16, SystemTracker:g"
So this is indeed the string generated by Exception.ToString() and it’s almost 10MB because the call stack is so deep and the method names are so long – that explains why we’re spending so much time in GetStackStrace – it all makes sense now.
The next morning, I get a reply from the CLR folks who do confirm that getting a callstack can be slow and is done in cooperative mode (i.e. it’s not interruptible) and that it’s also not particularly efficient because the hash table that maps method addresses to method names for is not sized correctly – since I have dump, I take a look and sure enough, they’re right (those guys are really good):
0:000> x clr!g_pDebugInterface 00007fff`516851d0 clr!g_pDebugInterface = 0x000002f3`6f08f8e0 0:000> dt -t clr!Debugger 0x000002f3`6f08f8e0 +0x000 __VFN_table : 0x00007fff`51478af0 +0x018 m_processId : 0x4ae4 +0x01c m_trappingRuntimeThreads : 0n0 +0x020 m_stopped : 0n0 +0x024 m_unrecoverableError : 0n0 +0x028 m_ignoreThreadDetach : 0n0 +0x030 m_pMethodInfos : 0x000002f3`6f981540 DebuggerMethodInfoTable 0:000> dt -t clr!DebuggerMethodInfoTable 0x000002f3`6f981540 +0x000 __VFN_table : 0x00007fff`5147fb08 +0x008 m_pcEntries : 0x000002f3`3731f040 +0x010 m_iEntrySize : 0x38 +0x014 m_iBuckets : 0x65 +0x018 m_piBuckets : 0x000002f3`6f104960 -> 0x171b1 +0x020 m_iFree : 0x171bd +0x024 m_iEntries : 0x258b4 0:000> ? 0x258b4 Evaluate expression: 153,780 = 00000000`000258b4
Even better, the CLR folks open an issue on GitHub to track the bug!
But you will ask, why didn't we see those exceptions in our telemetry? Well that's because those strings are way over the ETW limit (32KB) which means they just get dropped on the floor (yeah, that's bad and I have fixed it since).