Debugging Tips for Multi-Threaded Application
Multi-threaded applications are error-prone and hard to debug, so it's worth a dedicated topic. I will try to maintain a list of tips for debugging multi-threaded application using Visual Studio and WinDBG.
Below is a trivial multi-threaded application which will be used as an example:
 #define WIN32_LEAN_AND_MEAN

#include <Windows.h>

DWORD WINAPI ThreadProc(LPVOID lpParameter)
{
  return 0; // add breakpoint here
}

int __cdecl main()
{
  HANDLE hThread = CreateThread(NULL, 4096, ThreadProc, NULL, 0, NULL);
  if(hThread)
  {
    WaitForSingleObject(hThread, INFINITE);
    CloseHandle(hThread);
  }
}
In the Visual Studio IDE, set a breakpoint at line 5 and Start Debugging (F5), you should be able to see the following Call Stack:
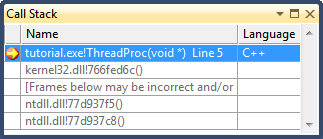
Note that in the Call Stack window, frames from kernel32.dll and ntdll.dll were formatted as address, this is because we haven't load the symbols yet. In this demo, we will avoid using public symbols, instead, modify the debugger setting from menu [Debug] -> [Options and Settings...]:
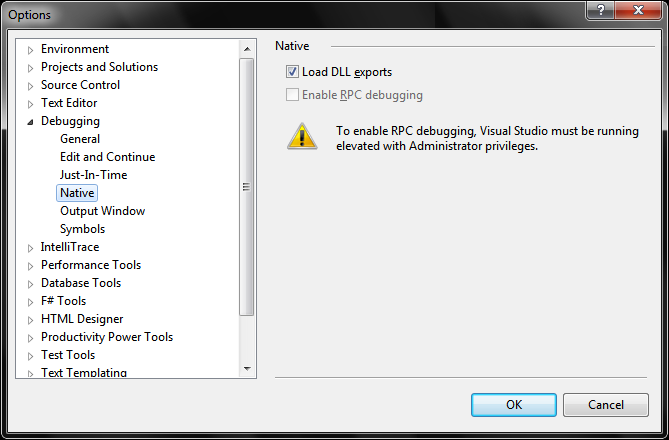
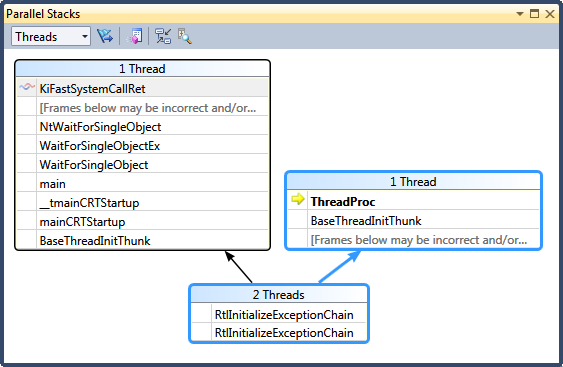
Check the "Load DLL exports" from the Options dialog window. Now launch the debugger again, and instead of using the Call Stack window, open the Parallel Stacks window from menu [Debug] -> [Windows] -> [Parallel Stacks]:
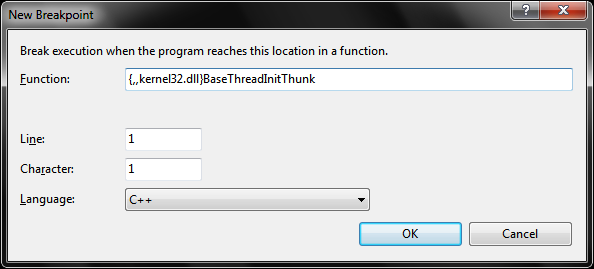
One common task for multi-threaded debugging is to track thread creation, which is normally achieved by setting breakpoint at thread creation. We will take another approach by breaking at the very beginning. Ctrl + B and add a breakpoint at {,,kernel32.dll}BaseThreadInitThunk, then launch the debugger again to see what would happen:
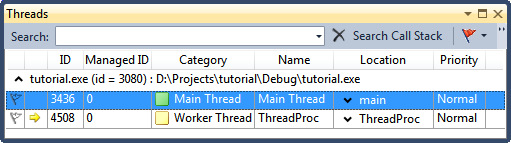
Another common task is to track thread (context) switch, this is extremely useful while debugging async applications. When we hit the breakpoint in ThreadProc, open the Threads window from [Debug] -> [Windows] -> [Threads]:
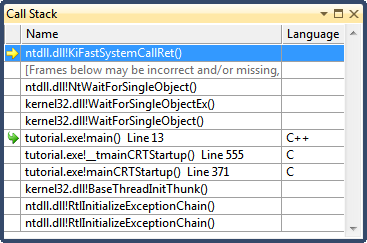
Right click on the "Main Thread", and from the popup menu, choose [Switch to Thread]. Now the Call Stack window should look like:
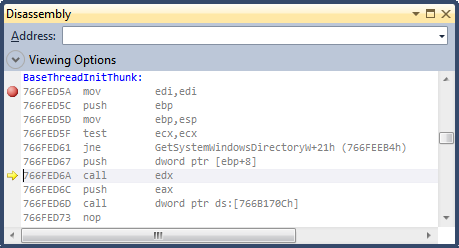
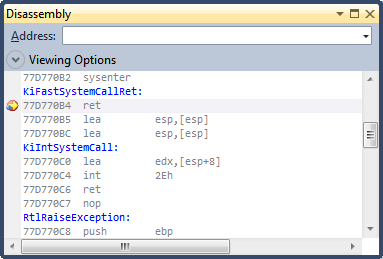
Double click on the top frame ntdll.dll!KiFastSystemCallRet, and set a breakpoint at the disassembly window (alternatively, you may set breakpoint by right clicking the top frame, and select [Breakpoint] -> [Insert Breakpoint] from the popup menu):
Right click on the breakpoint (the red dot), from the popup menu choose [Filter...], and type in "ThreadId = 3436" where the 3436 is the main thread ID which shows in the Threads window (you will need to fill in the correct thread ID by checking the Threads window). Now if the main thread got activited, we will hit into this breakpoint, don't forget to clear it once hitted.
Homework:
- In the popup menu of right clicking on a breakpoint, there are a number of items such like [Location...], [Condition...], [Hit Count...], [Filter...]. Can we use Hit Count in combination with Filter (ThreadId = xxx) to capture context switch?
- Would you try to figure out the execution order of determining whether to break or not, given the constraints of Location, Condition, Hit Count and Filter?
- Are these breakpoint constraints work well with Data Breakpoints?
- How to check the return value of a thread procedure?