The Pitfalls of Code Coverage
When used correctly code coverage can be a great data point to assess your test quality and test holes. What a lot of people don’t realize though is that code coverage doesn’t actually means good tests or even that all the areas that are covered are actually tested correctly. There are several things you should keep in mind when looking at code coverage numbers which we’ll look at here.
What is code coverage?
If you’re already familiar with code coverage just browse over the code samples (as I’ll reference them later) and skip to the next section. I’m not going to go into details here but rather define the basic things one needs to know and show a small example using the MsTest code coverage tool in Visual Studio. The first concept with code coverage is blocks which represent sections of your code. Take the following application as an example:
01 class Program
02 {
03 static int Main(string[] args)
04 {
05 int value;
06 if (Int32.TryParse(args[0], out value))
07 {
08 if (value >= 0)
09 {
10 return FuncA(value);
11 }
12 else
13 {
14 return FuncB(value);
15 }
16 }
17 else
18 {
19 return 0;
20 }
21 }
22
23 static int FuncA(int value)
24 {
25 return value + 1;
26 }
27
28 static int FuncB(int value)
29 {
30 return value - 1;
31 }
32 }
That application contains thirteen blocks but for simplicity I’m going to name the major ones
· Line 6
· Line 7-8
· Lines 9-10
· Lines 13-14
· Lines 24-26
· Lines 29-31
The simplest way of visualizing a block is a continuous block of code that executes some code. Notice for example how the declaration of value at line 5 doesn’t counts as a block. In general you’ll never really worry about where blocks are since code coverage applications do that for you. When a test executes some blocks will be hit and the percentage of blocks hit will be your code coverage numbers.
I added this simple test to my project:
[TestMethod()]
[DeploymentItem("ConsoleApplication3.exe")]
public void MainTest1()
{
string[] args = new string [] {"0"};
int expected = 1;
int actual = Program_Accessor.Main(args);
Assert.AreEqual(expected, actual);
}
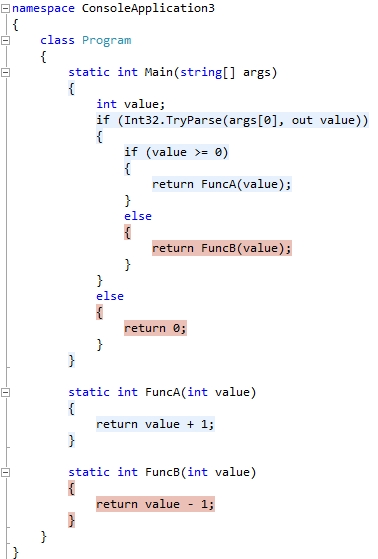
After running the test I get the following numbers:
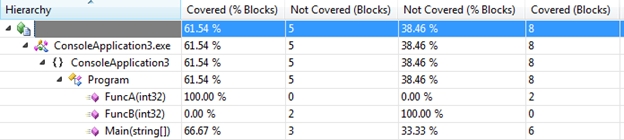
And Visual Studio colors the blocks to show me what’s covered (blue) and what’s not covered (orange):
A good test and a bad test that have the exact same coverage
Code coverage will only show you which portions of your code were executed when running a test but it will not tell you if those portions of the code actually behaved correctly. That means that code coverage is somewhat reliable in order to say things like my application runs with the following input set. It doesn’t tell you however how resilient or buggy your application might be. On the test side it doesn’t means that your tests aren’t a pile of garbage, just that they touch certain spots.
Take the same simple test we used above (and keep in mind this is a simple application and this is an extreme case). If I removed the last line of the test (the one that does the verification) the code coverage numbers will come back exactly the same. Let’s take that a step further and run this test:
[TestMethod()]
[DeploymentItem("ConsoleApplication3.exe")]
public void MainTest2()
{
string[] args = new string[] { "0" };
Program_Accessor.Main(args);
args = new string[] { "-1" };
Program_Accessor.Main(args);
args = new string[] { "a" };
Program_Accessor.Main(args);
}
There are no verifications whatsoever on that test but if you’re just going on code coverage you just wrote the perfect test:

I have to add a disclaimer here, while that’s the worst test you can write when doing functional and correctness testing it has its value if you’re running stress testing as it’s touching all of the code.
Background work items
Here’s one of those cases where things get tricky. If you’re testing a more complex app chances are it’s a multithreaded app and there’s some work going on in the background most of the time. Here’s an actual example I ran into a few weeks ago. I was running some tests for one of our language services and here’s how the test looked like:
1) Open a file
2) Wait for the file to be colorized in the editor window
3) Verify that it’s colorized correctly
Keep in mind that code coverage is per assembly and the assembly contains the whole language service which includes way more than just colorization. I had run these tests before and the code coverage was around the 30% range but this time it gave me around 80%. You can imagine my surprise when the exact same of tests gave me 50% more coverage when there had been no changes to the code base. How did that happen?
Let me briefly explain here how a language service work (which will give you a hint of where the extra coverage comes from). When you open a file Visual Studio loads the language service associated with that extension. Most language services start by parsing the file in order to find the classifications, and then run other components for more complex information (outlining, intellisense, etc). All of these, including the colorization, are done in separate threads in the background after the document is loaded.
The difference here between previous runs and this one is that I had a bunch of other things opened in my machine that were consuming resources and thus slowing down the test. Usually the tests are pretty fast so as soon as colorization was finished the test exited. In this case that extra time that the test was running allowed some of these other background operations to complete. Easy way of proving this theory, add a fourth step to the test that sleeps for 10 seconds. Every single time I ran the test with that it hit the 80% mark.
The one take away here, if your code coverage is hitting more blocks than the scenario you’re actually testing its most likely that it’s due to background operations and your total coverage is bloated.
So what does code coverage data actually tells me?
The one thing that’s absolute about code coverage is that if you’re not getting code coverage in one area it’s simply not tested at all. You can take this information to:
a) Add more tests for that area.
b) Figure out which edge cases you haven’t tested yet.
c) What portions of the code you’re purposely not testing.
One additional note to that last point, while having 100% code coverage looks nice it shouldn’t (and usually isn’t) a realistic goal. A well coded application will probably have some redundant fault tolerance that it’s expensive to test on a regular basis. For example let’s say the application queries some services which can rarely crash. A good application will be resilient to this but testing that could be expensive (say for example you would have to go and corrupt some memory in order for this to happen). There is a point of diminishing returns here.
Conversely you can use the data from the things you are covering to:
a) Reduce code bloat by eliminating duplicated tests - Yes there can be such thing as too many tests.
b) Ensure that your mainstream scenarios are covered – This is particularly useful when you’re evaluating the coverage on a subset of tests that you want to prioritize versus running your full set of tests.
c) Optimize your test bed – If running your tests is expensive you can use code coverage as a supplementary data point as to add the minimum number of tests that give you the maximum amount of coverage.
The key point here is that code coverage is a very important part of testing in the software cycle however it should be used as a tool rather than a primary data point to make decisions. The numbers should always be analyzed and the conclusions should come out of that analysis not out of the numbers themselves.