Analyzing Aliens preference using Powerview
The day I watched Aliens, I was always fascinated about that topic. More than Aliens I was more interested in Crop Circles. Crop Circles in particular because it has a lot of fallacy ( As I believe in Aliens!) :) and also due to the reason of its complexity and geometry involved in it. So, I took up a challenge to unearth the mystery behind the same.
I Bing'ed to get some facts about the Crop Circle Sightings around UK for the year 2009 and Also visited Met Office to collect few data points on how the weather was for the year 2009. All the weather was an Avg. Temperature from Min/Max of the day, Rainfall(mm) and also sunshine for that particular month in UK.
After Importing the data, I had to insert few images in my PowerPivot to make it interesting to present in visualization, So had to download and add those images in my PowerPivot.
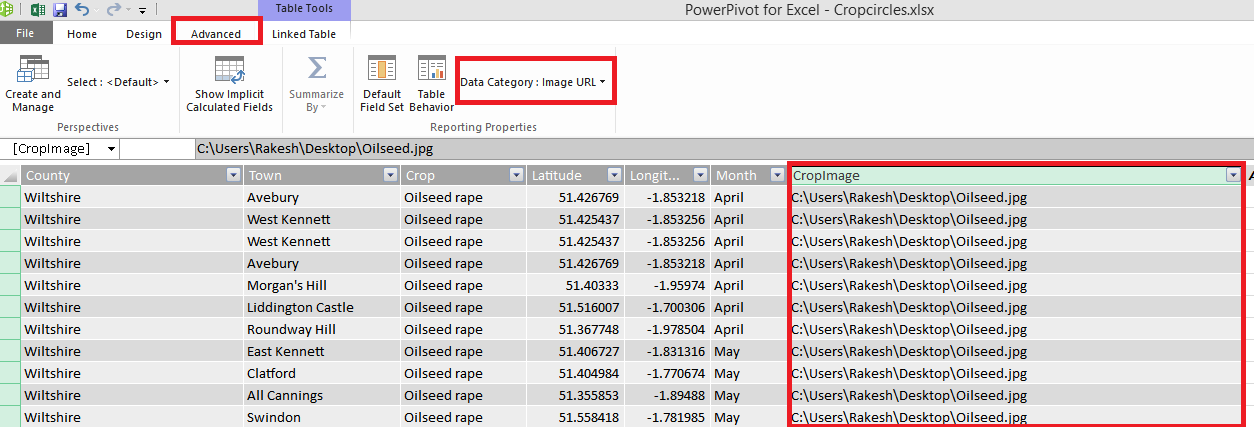
The above image is posted as most of the developers in msdn ask Questions on how to upload image in PowerPivot.
Anyways, Once we had the data I used Powerview (Office 2013) to visualize the data.
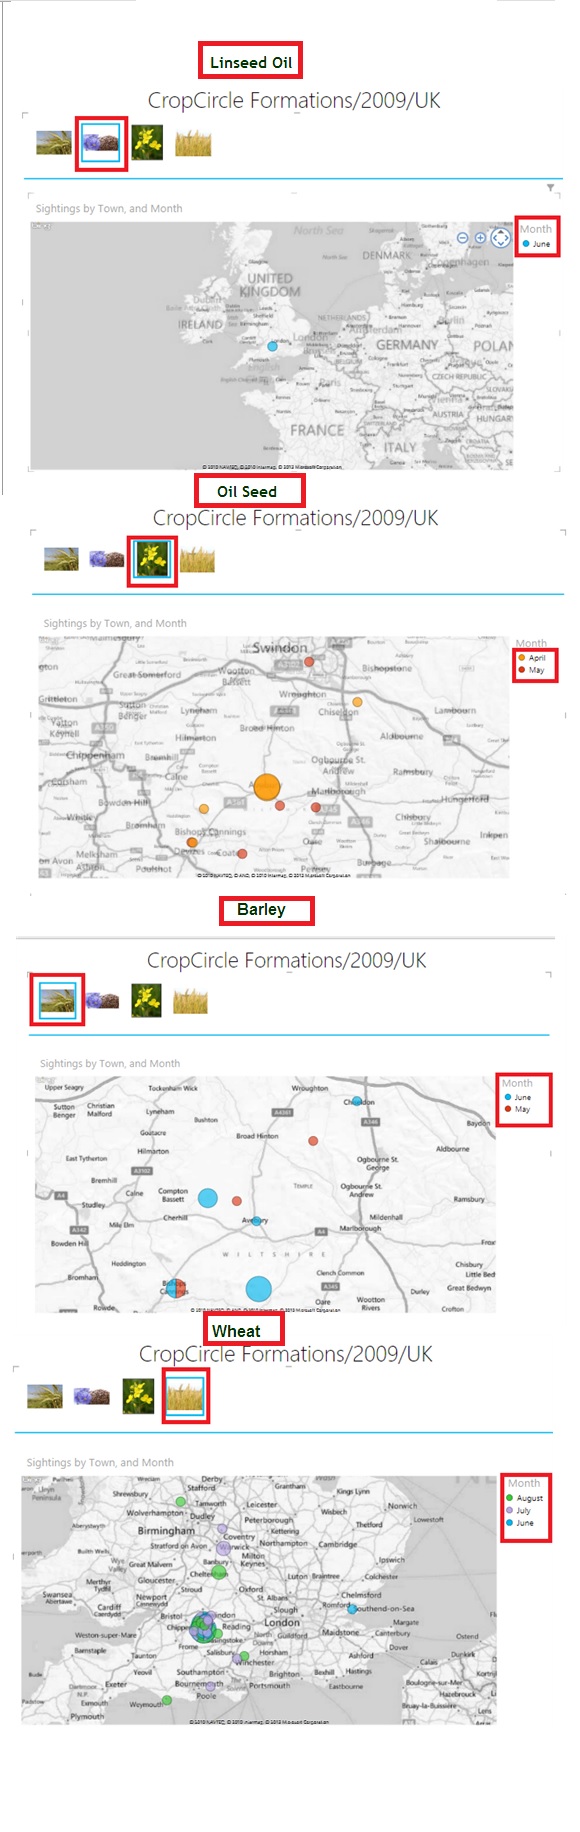
Ok, Now we know that Aliens like April,June and July a lot ! and Barley and Wheat ! You know why barley and wheat :)
So, Whats so special in April,June and July Lets see that weather scorecard.
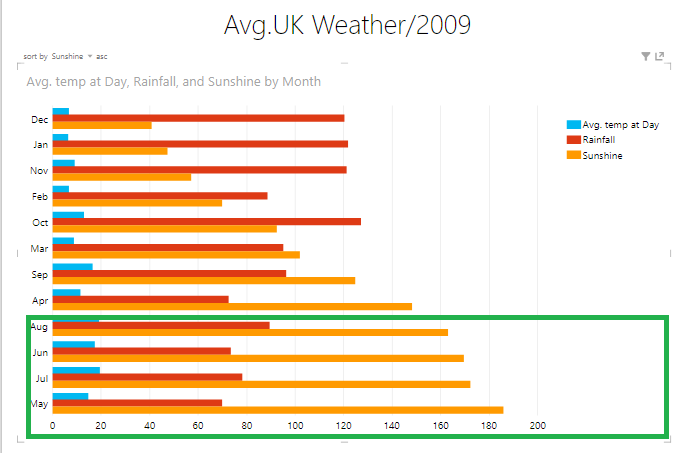
Conclusion :
1. Aliens like to relax in the sunshine
2. During sunshine they also like to prepare Juice ( Using Barley and Wheat ! :)) ! You guessed it right !
[Update] :: You can download the above PowerPivot from the link below
https://blogs.msdn.com/controlpanel/blogs/postlist.aspx?WeblogID=15553