Dynamic Dashboards in Performance point services 2010
For a long time I wanted to share this information with the report developers .Performance point services allows you to create dynamic dashboards which means you can connect a scorecard and a report and make each other interdependent.
Below are the step by step guide
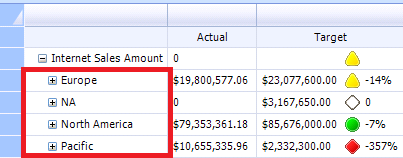
Step 1.Create scorecard has "sales territory" in the rows .
Step 2.Create the Report
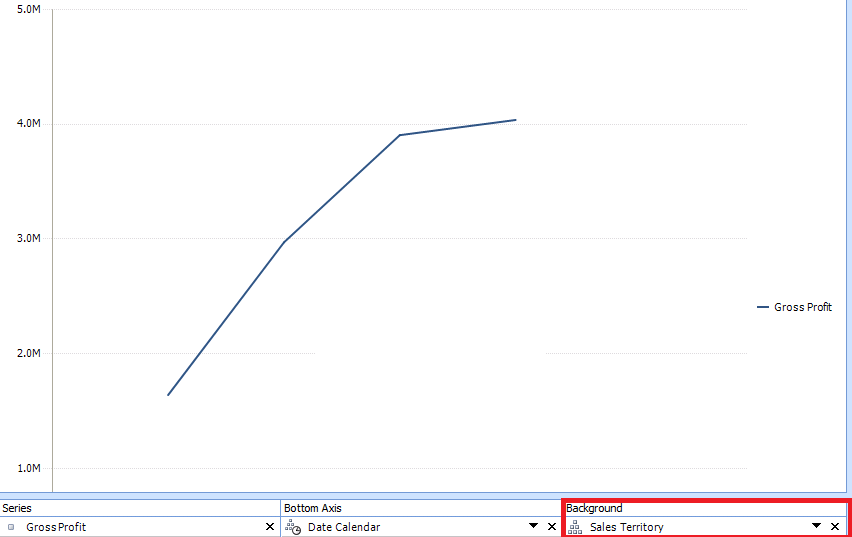
The below is the report which I need to join with the above scorecard and the objective is to change the line graph when the user selects a "sales territory" from the above scorecard. For ex: when user selects "europe" change the report to show trend graph only for "europe" so on for "North America" .
- To achieve this need to have both the items (report and scorecard) from the same OLAP datasource.
- I have "Sales Territory" in the background so that it can be linked with the scorecard.
3. Create a dashboard and create connection
Then you need to create an dashboard and add Report and the Scorecard to it.
Quick things to look out for :
- The Report and Scorecard are connected using the Display Condition
- You need to select the Row Member or Column Member
- Row Member is the Attribute you have in your rows of the your scorecard.
- Column Member is the Attribute you have in your columns of the scorecard.
- You can also select the KPI itself if you need to connect it with the report.
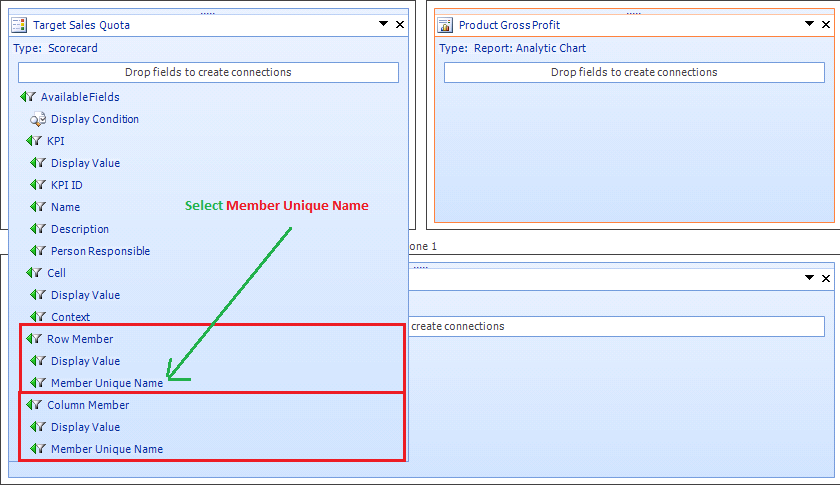
- Select the Member UniqueName from the above selected fields ( Row or Column Member )
For our dashboard I am connecting "Sales Territory" which is RowMember (see the aboveScorecard)
So, Hover above the Row Member --> Member unique Name and drag and drop it into the Report which is an Analytic chart.
Once you are done with the above steps, You will observe the below pop-up which gives you the detailed information about the fields which are connected.
Observe :
- Connect to : Destination field which needs to be connected
- Source Value : The value gets passed from this field to the destination .
Next step, Deploy the above dashboard into SharePoint site. After that ...oopphh its all done.
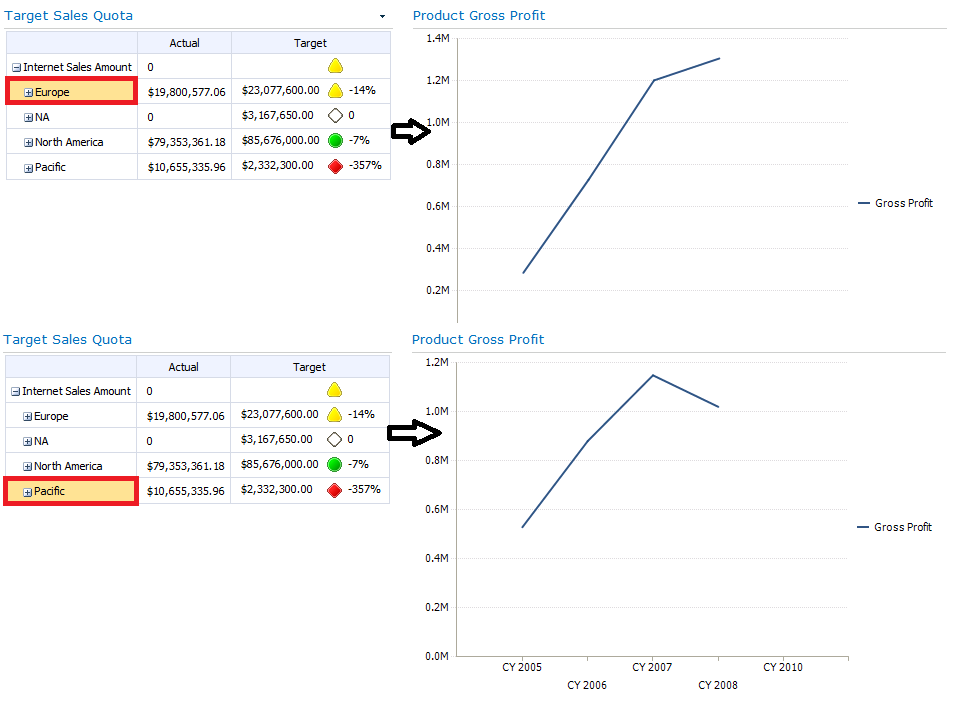
See the below images, When clicked on "Europe" you will see graph report for "Europe" and so on.
Thats all for now, share your feedbacks and comments below :)