Introducing Newly Improved WPF Performance Profiling Tools
Thinking about profiling your WPF applications to find out where the performance bottlenecks are? Check out the newly improved WPF Performance Profiling tool at https://windowsclient.net/wpf/perf/wpf-perf-tool.aspx if you haven’t had the chance, I highly recommend this new version! The WPF Performance blog also has quite a few good performance related posts and resources.
H I G H L I G H T S
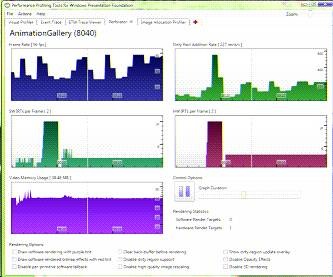
1) Performance Profiling Tool for WPF (WpfPerf)
The new and improved WpfPerf Performance Profiling tool is finally live on WindowsClient.net
See here: https://windowsclient.net/wpf/perf/wpf-perf-tool.aspx
More details also posted on the blog here.
2) WPF ETW Event Tracing:
A detailed documentation for our WPF ETW Event Tracing is also finally live on WindowsClient.net
See here: https://windowsclient.net/wpf/white-papers/event-tracing-wpf.aspx
A WPF sample that consumes ETW is uploaded to our blog here.
Joel Reyes
Technorati Tags: WPF,WPF Performance Profilling Tool