Understanding Optimizer Timeout and how Complex queries can be Affected in SQL Server
What Is Optimizer Timeout?
SQL Server uses a cost-based query optimizer. Therefore, it selects a query plan with the lowest cost after it has built and examined multiple query plans. One of the objectives of the SQL Server query optimizer (QO) is to spend a "reasonable time" in query optimization as compared to query execution. Therefore, QO has a built-in threshold of tasks to consider before it stops the optimization process. If this threshold is reached before QO has considered most, if not all, possible plans then it has reached the Optimizer TimeOut limit. An event is reported in the query plan as Time Out under "Reason For Early Termination of Statement Optimization." It's important to understand that this threshold isn't based on clock time but on number of possibilities considered. In current SQL QO versions, over a half million possibilities are considered before a time out is reached.
Optimizer timeout is designed in Microsoft SQL Server and in many cases encountering it is not a factor affecting query performance. However, in some cases the SQL query plan choice may be affected by optimizer timeout and thus performance could be impacted. When you encounter such issues, if you understand optimizer timeout mechanism and how complex queries can be affected in SQL Server, it can help you to better troubleshoot and improve your performance issue.
What are the Symptoms?
Here are some of the factors involved:
- You have a complex query that involves lots of joined tables (for example, 8 or more tables are joined).
- The query may run slowly or slower than when you compare it to another SQL Server version or another system.
- The query plan of the query shows the following information in the XML query plan: StatementOptmEarlyAbortReason="TimeOut". Or, if you verify the properties of the left-most plan operator in Microsoft SQL Server Management Studio, you notice the value of "Reason For Early Termination of Statement Optimization" is “TimeOut.”
For example, the following is the XML output of a query plan that shows the optimizer timeout:
 <?xml version="1.0" encoding="utf-16"?>
<ShowPlanXML xmlns:xsi="https://www.w3.org/2001/XMLSchema-instance" xmlns:xsd="https://www.w3.org/2001/XMLSchema" Version="1.518" Build="13.0.5201.2" xmlns="https://schemas.microsoft.com/sqlserver/2004/07/showplan">
 <BatchSequence>
  <Batch>
   <Statements>
    <StmtSimple StatementCompId="6" StatementEstRows="419.335" StatementId="1" StatementOptmLevel="FULL" StatementOptmEarlyAbortReason="TimeOut"  ......>
    ...
   <Statements>
  <Batch>
<BatchSequence>
The following is an example of a graphical representation of a plan, which displays a "TimeOut" value: 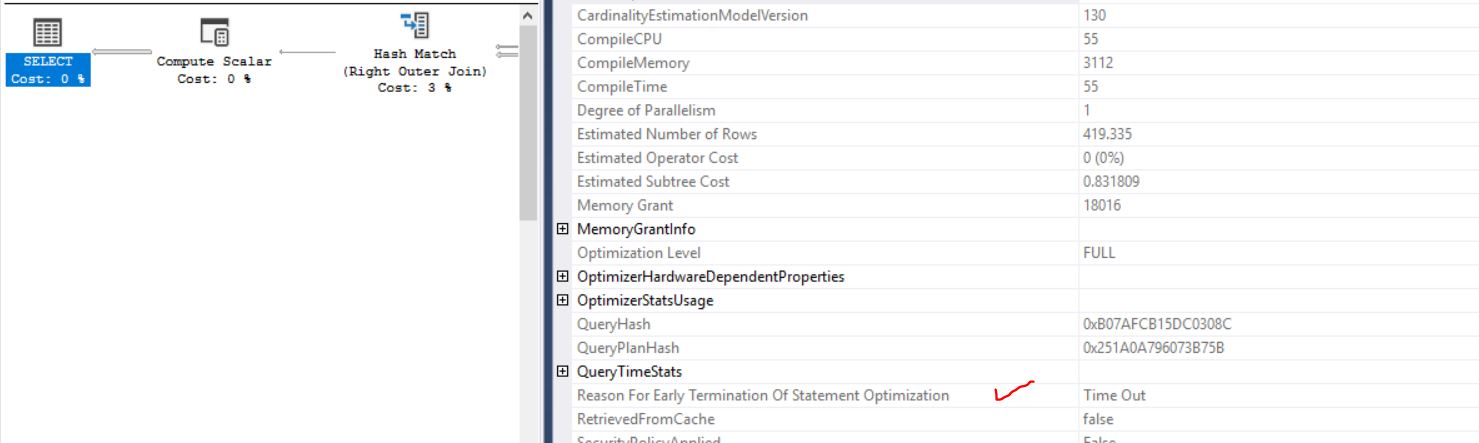
How does it work, then?
There's no simple formula to determine what conditions would cause the optimizer threshold to be reached or exceeded. However, the following are some factors that determine how many plans are explored by QO in the process of looking for a "best plan":
- In what order to join tables:
- join Table1 with Table2 and the result with Table3
- join Table1 with Table3 and the result with Table2
Note The larger the number of tables, the larger the possibilities are.
- What heap or binary tree (HoBT) access structure to use to retrieve the rows from a table:
- Nonclustered Index1
- Nonclustered Index2
- Clustered index, and so on
- What access method:
- index seek
- index scan
- table scan
- What physical join operator to use :
- Nested Loop
- Hash Match
- Merge Join (NL, HM, MJ)
- Should a parallel plan be used or a serial one?
To illustrate, take an example of a join between 3 tables (T1, T2 and T3) and each table has a clustered index only. There are two joins involved here and because there are 3 physical join possibilities (NL, HM, MJ), then each of the two joins can be performed in 6 (2 * 3) ways. Also consider the join order:
- T1 joined to T2 and then to T3
- T1 joined to T3 and then to T2
- T2 joined to T3 and then to T1
Now multiply 6 ways * 3 join orders and we have a minimum of 18 possible plans to choose from. If you include the possibility of parallelism and other factors like Seek or Scan of the HoBT, then the possible plans increase even more. If you are a math wizard you can figure out that when a query involves for example 10 tables, the possible permutations there are in the millions. Therefore, you can see that a query with lots of joins is more likely to reach the optimizer timeout threshold than one with fewer joins.
Note The query predicates (filters in the WHERE clause) and existence of constraints will reduce the number of access methods considered and thus the possibilities considered.
The result of reaching the optimizer timeout threshold is that SQL Server has not considered the entire set of possibilities for optimization and it may have missed a set of plans that could produce shorter execution times. QO will stop at the threshold and consider the least-costly query plan at that point, although there may be better unexplored options. This may result in a query execution that's suboptimal.
But I see an Optimizer Timeout with a simpler query?
Nothing with QO is simple (black and white). There are so many possible scenarios, its complexity so high that it is hard to grasp all of the possibilities. The Query Optimizer may dynamically adjust/set timeout threshold based on the cost of the plan found at a certain stage. For example, if a plan that appears relatively "cheap" is found, then the task limit to search for a better plan may be reduced. Therefore, grossly underestimated cardinality estimation may be one example for hitting an optimizer timeout early. In this case, the focus of investigation is cardinality estimation. This is a rarer case than the scenario that's discussed previously about running a complex query, but it is possible.
So, what do I do?
You may have to do nothing. In many cases the plan you get is quite reasonable and the query you are running is performing well. But in the cases where you find the need to tune and optimize, consider the following options:
First, do this:
- Establish that the query under investigation is slower when you compare it to running on a different build of SQL Server or using a different CE configuration or different system. One of my mottos in performance tuning is "There is no performance problem without a baseline"
- Examine your query in detail when you determine its complexity. Upon initial examination, it may not be obvious that the query is complex and involves many joins. This is the common case when views or table-valued functions are involved. For example, on the surface the query may seem to be simple because it joins two views. But when you examine the views, you may find that each view joins 7 tables; When the two views are joined, you end up with a 14-table join.
The following are different alternatives that you can explore to help improve the performance of the query. Again, be aware that the fact that an optimizer timeout is present in a query plan, does not necessarily mean that it's the reason for query slowness.
- Force a particular plan: If you determine that a particular plan is better for your query through testing, ask QO to select that plan. To do this, check out the following reference articles:
- Try to reduce the permutations/possibilities that QO needs to consider. This involves testing the query with different options. Note: As is with most decisions with QO, the choices are not always deterministic because there is a large variety of factors considered. Therefore, there is no one guaranteed successful strategy. These may improve or worsen the performance of the selected query. For more information, see Query Hints:
- Eliminate the order permutations: OPTION (FORCE ORDER)
- Reduce the JOIN possibilities: OPTION (HASH JOIN, MERGE JOIN), OPTION (HASH JOIN, LOOP JOIN) or OPTION (MERGE JOIN)
- Change Cardinality Estimation (CE) configuration: You can attempt to change the Cardinality Estimation configuration by switching from Legacy CE to New CE or from New CE to Legacy CE. Changing the Cardinality Estimation configuration can cause the QO to pick a different path when SQL Server evaluates and creates query plans. So even if an optimizer timeout issue occurs, it is possible that you end up with a plan that performs more optimally than the one selected using the alternate CE configuration. For more information, see how you can assess and choose the best cardinality estimation configuration for your SQL Server system.
- Optimizer fixes: If you have not enabled QO fixes via T4199 or by using database compatibility levels for SQL Server 2016 and later or ALTER DATABASE SCOPED CONFIGURATION ..QUERY_OPTIMIZER_HOTFIXES = ON, you may consider applying these fixes. This may cause the optimizer to take a different path in plan exploration and therefore possibly end up with a more optimal query plan. For more information, see SQL Server query optimizer hotfix trace flag 4199 servicing model.
- Re-write the query: Consider breaking up the single multi-table query into multiple queries by using temporary tables. However, you shouldn't always do this, breaking up the query is just one of the ways to simplify the task for the optimizer. See the following sample:
 select ...
from t1
join t2
on t1.id = t2.id
join t3
on t3.id = t2.id
join t4
on t4.id = t3.id
To optimize, try to break down into two queries:
 select ...
into #temp1
from t1
join t2
on t1.id = t2.id

select ...
From t3
join #temp1
on t3.id = #temp1.id
join t4
on t4.id = t3.id
Important: Using Multiple Common Table Expressions (CTEs) is not an appropriate solution to simplify a query. Multiple CTEs will only increase the complexity of the query. Therefore, it’s counterproductive. CTEs appear to break a query logically, but they are combined into a single query and optimized as a single large join of tables in the end.
Enjoy!
Joseph Pilov