SQL Nexus 5.5.0.1 was released
We just released SQL Nexus 5.5.0.1 on codeplex. In addition to numerous ‘rules’ that catch issues that can potentially impact your SQL Server performance, we added quite a few reports. Some of the reports are displayed below.
The following three were born out of troubleshooting experience.
“Top 20 Active CPU Intensive Queries”: When troubleshooting CPU issues, we either rely on RML Utilities (which integrates with SQL Nexus) or use sys.dm_exec_query_stats DMV. Both aggregate CPUs from finished queries. There are times active queries consume most of the CPU. This report will help you catch those queries. The screenshot below came from a real customer experience. We masked off the query text. As you can see, the “SELECT TOP 51” consumed lots of CPU and logical reads but they were still running. When we were troubleshooting, we were puzzled why the system has 100% CPU utilization but the CPU consumed by queries didn’t add up to even half of it. This led to digging of unfinished queries and this report.
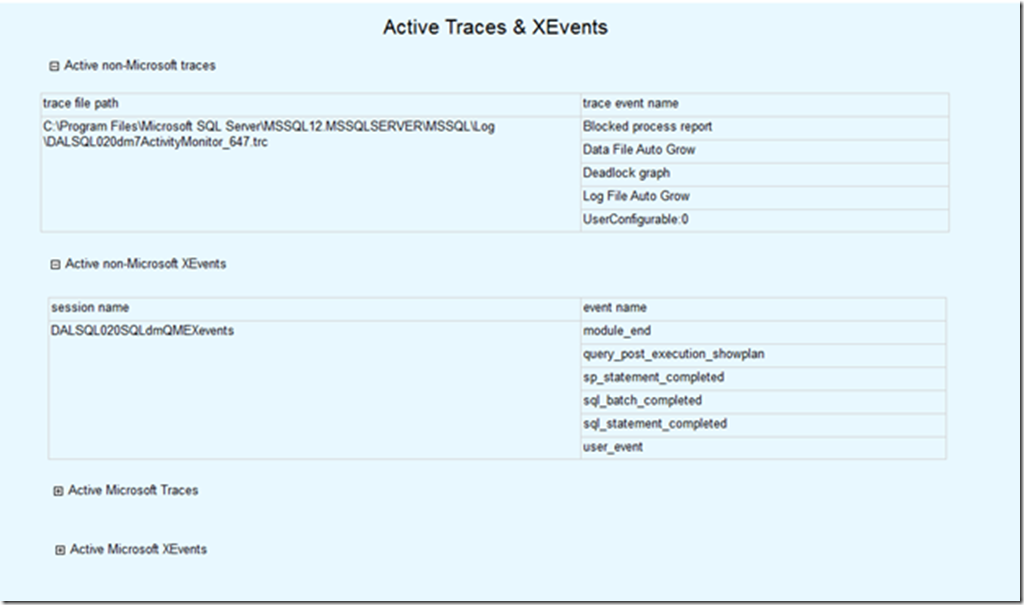
“Active Traces & XEvents”: We found that sometimes DBAs misuse monitoring tools and end up capture excessive data in either trace or Xevents. Some events can cause performance issues. This report displays event details.
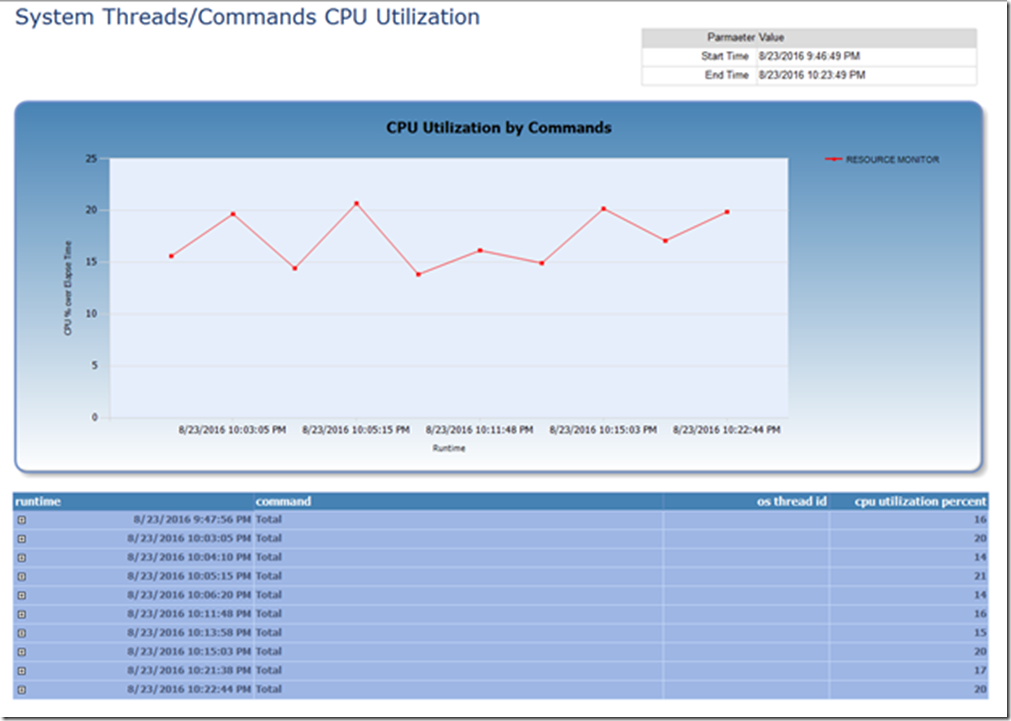
“System thread CPU consumption”: This report charts the CPU consumption of system threads over time. Though rare, some times system threads can consume high CPU. This report helps shed some lights on system thread activities.
Jack Li |Senior Escalation Engineer | Microsoft SQL Server


