A faster CHECKDB – Part III
Bob Ward introduced Part 1 and Part 2 of ‘A faster CHECKDB’ as highlighted in the following links.
Part 1: https://blogs.msdn.com/b/psssql/archive/2011/12/20/a-faster-checkdb-part-i.aspx
Part 2: https://blogs.msdn.com/b/psssql/archive/2012/02/23/a-faster-checkdb-part-ii.aspx
Recently, Jonathan pointed out a memory grant issue in the following post.
I always enjoy my interactions with Jonathan and this is yet another positive experience for us all. After digging into this I found there is a bug and it was corrected in the SQL Server 2014 release.
The heart of the matter is a cardinality problem for the estimated number of fact rows. The cardinality estimation drives a large portion of the memory grant size calculation for the DBCC check commands. As Jonathan outlines in his post the overestimate is often unnecessary and reduces the overall performance of the DBCC check operation.
The checkdb/checktable component responsible for returning the number of fact rows (cardinality) for each object mistakenly returned the size of the object as the number of rows.
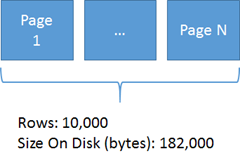
The following example shows 10,000 rows, requiring 182,000 bytes on disk.
Prior to SQL Server 2014 the SQL Server code would return a cardinality estimate based on 182,000 instead of 10,000. As you can easily see this is an significant, row estimate variance.
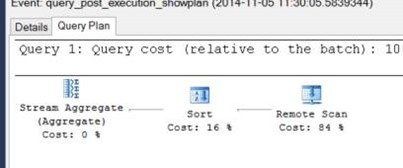
If you capture the query_post_execution_showplan (or pre) you can see the checkindex plan used by the DBCC check operation.
Shown in the table are plan excerpts from SQL Server 2012 and SQL Server 2014, using an EMPTY, table. Notice the estimate is near 2 pages in size (8192 * 2) and for an empty table SQL Server only produces 3 total facts related to allocation state.
| SQL 2012 | <StmtSimple StatementEstRows="129.507" StatementOptmLevel="FULL" <QueryPlan DegreeOfParallelism="0" MemoryGrant="33512" NonParallelPlanReason="MaxDOPSetToOne" CachedPlanSize="24" CompileTime="0" CompileCPU="0" CompileMemory="128"> <RelOp NodeId="1" PhysicalOp="Sort" LogicalOp="Sort" EstimateRows="16772 <RunTimeInformation> < RunTimeCountersPerThread Thread="0" ActualRows="3" ActualEndOfScans="1" ActualExecutions="1" /> |
| SQL 2014 | <StmtSimple StatementEstRows="10" StatementOptmLevel="FULL" <QueryPlan DegreeOfParallelism="0" MemoryGrant="1024" NonParallelPlanReason="MaxDOPSetToOne" CachedPlanSize="24" CompileTime="0" CompileCPU="0" CompileMemory="128"> <RelOp NodeId="1" PhysicalOp="Sort" LogicalOp="Sort" EstimateRows="9" <RunTimeInformation> < RunTimeCountersPerThread Thread="0" ActualRows="3" ActualEndOfScans="1" ActualExecutions="1" /> |
A more dramatic difference is shown from a test I ran against a 1.3 trillion row table, without the fix. The estimated rows are 900 trillion with a memory grant size of 90GB.
Prior to SQL Server 2014 you can leverage Jonathan’s advice and limit the DBCC check using Resource Governor or move to SQL Server 2014 to execute your DBCC check operations faster.
Note: This issue has been corrected in SQL Server 2012 SP2 CU4 - https://support.microsoft.com/en-us/kb/3007556
Bob Dorr - Principal SQL Server Escalation Engineer

