How It Works: XEvent Output and Visualization
Each and every day I use XEvent more and more as I uncover the powerful feature set. I am finding it helpful to understand some of the input and output capabilities in order to leverage the power of XEvent.
Server File Output
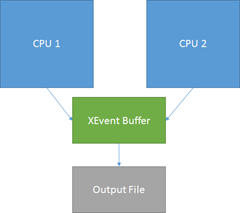
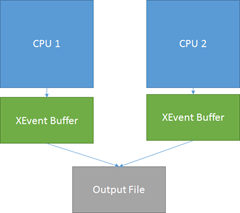
When setting up an session to write to a file use per CPU partitioning (BY CPU) and increase the memory size to accommodate .5 to 4MB per CPU. The BY CPU configuration reduces contention on the output buffers as each CPU has private buffer(s).
Without going into all the details of how many active buffers can be achieved, the asynchronous I/O capabilities and such, the following shows the core performance gain when using per CPU partitioned output.
| No partitioning: CPUs complete to insert events into same buffer. | CPU Partitioning: CPUs have private buffers |
 |
 |
Visualization (Using the event data)
The per CPU partitioning is used to reduce the impact of tracing the production server. However, the divide and conquer activity for capture means you have to pay attention to the details when using looking at the data.
A buffer is flushed to the file when it becomes full or the data retention period is met.
This all boils down to the fact that you must sort the events by timestamp (better if you use Action: event_sequence) before you attempt to evaluate the events.
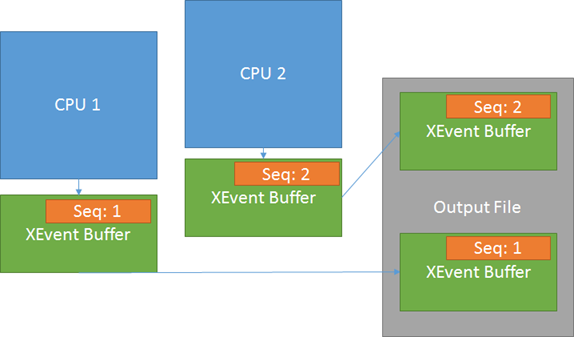
Take the following as an example. You have 2 connections to the SQL Server but the connection assigned to CPU 2 does more work than the connection assigned to CPU 1.
- The connection on CPU 1 executes the first command and produces event_sequence = 1 into the local, storage buffer.
- The connection to CPU 2 executes the second command and produces event_sequence = 2, 3, 4, 5, … into the local storage buffer.
- CPU 2’s buffer is filled before CPU 1’s buffer and flushed to the XEvent file.
When you open the XEL file in management studio (SSMS) the order of events displayed is physical file order.
-
- Sequence = 2
- Sequence = 3
- Sequence = 4
- Sequence = 1
Unless you have a very keen eye you might not even notice the ordering of events. You must sort the data by event_sequence or timestamp in order to reflect the true nature of the capture. You will encounter the same need to add an order by clause if you import the trace into a SQL Server database table.
Dispatch Latency
Be very careful when setting dispatch latency. The latency controls how long an unfilled buffer can hold events before sending them to the output stream. Using a value of 0 is really INFINITE, not flush immediately.
Take the same example from above with a long dispatch latency (minutes, INFINITE, ….). Now assume that CPU 2 keeps generating events but the connection to CPU 1 remains unused. The buffer for CPU 1 is not flushed until the trace is stopped or dispatch latency exceeded. Here is what I recently encountered when someone used the INFINITE dispatch latency.
| File | File time | Lowest Sequence in the file |
| 1 (Trace started) | 3:00am | 100000 |
| 2 | 3:20am | 200000 |
| 3 | 3:40am | 300000 |
| 4 | 4:00am | 400000 |
| 5 (Trace stopped) | 4:11am | 50000 |
The trace was captured with INFINITE dispatch latency. CPU # had very little event activity and didn’t flush the partial buffer until the trace was stopped. Other CPUs had activity and caused events to be flushed to the rollover files.
Looking for the problem at 3:10am I opened the XEL file covering the time window, 1 in this example. However, it was not until I included the 5th file into my research and sorted by the event_sequence that I saw the additional queries that occurred within the same time window and relevant to my investigation.
If I had only opened file 1 and grouped by Query Hash, ordering by CPU I would have missed the completed events in file 5.
CSS uses 5 to 30 seconds as a best practice for the dispatch latency setting, keeping the events near each other, across the CPU partitions.
SSMS runs in the Visual Studio 32 bit Shell
It is true that the SSMS, XEvent visualizations run in the Visual Studio 32 bit shell which limits the memory to a maximum of 4GB when running on an X64 WOW system. Does this mean I can only open or merge trace files up to 4GB in size?
The answer is NO you can generally exceed the trace file sizes by a 4:1 ratio. The design of the XEvent visualizer is to use the PublishedEvent’s EventLocator and owner draw cell activities. In some limited testing I observed use around ~250MB of memory for the events in a 1GB file. As you scroll around, filter, group, search, … we use the EventLocator(s) to access the data from disk and properly draw the cell or make a filtering, grouping, and search decision. You should be able to manipulate ~16GB of trace events using SSMS (your mileage may vary.)
Bob Dorr - Principal SQL Server Escalation Engineer
