Uneven query executions with parallelism
We had a customer who was doing stress testing on a machine with 40 cores. They designed a program that would launch multiple connections to execute the same query repeatedly based on their requirement to handle multiple concurrent executions. The query was very CPU intensive and a parallel plan was generated. As they increased concurrent connections to hundreds, the CPU would be pegged 100%.
What they noticed was that some connections executed the query far fewer times than others. In other words, the same query didn’t result in same execution time.
On the one hand, driving up CPU to 100% in a sustained period not healthy and the query needed to be tuned. On the other hand, the customer was puzzled as why the same query executions result in a large variation in terms of execution time. Some took much longer than others. They needed us to find out root cause.
First thing we did was to verify if there were different query plans for the same query. From looking at execution plans, they appeared to be the same. That made us really puzzled.
As it turned out, the plans were the same. But during execution phase, SQL Server decided how many threads to use for each execution of the query based on the load. In customer’s situation, because the CPU was pegged and very busy, SQL Server chose to execute some of the query serially. In other words, the parallel plan didn’t get executed with multiple threads. This created ‘uneven’ times because some were indeed executed with multiple threads and others were serially executed.
It’s not easy to spot this problem though. You will need to get “Showplan XML Statistics Profile” trace event.
Even after you get the trace event, it’s hard to spot the difference. You will have to understand what specific operator is doing and determine actual parallelism has occurred.
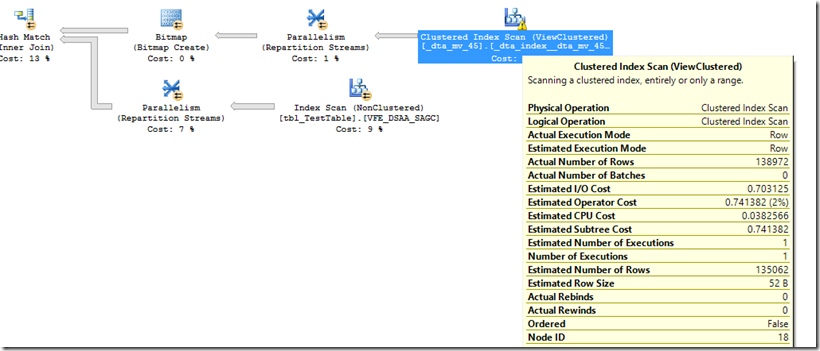
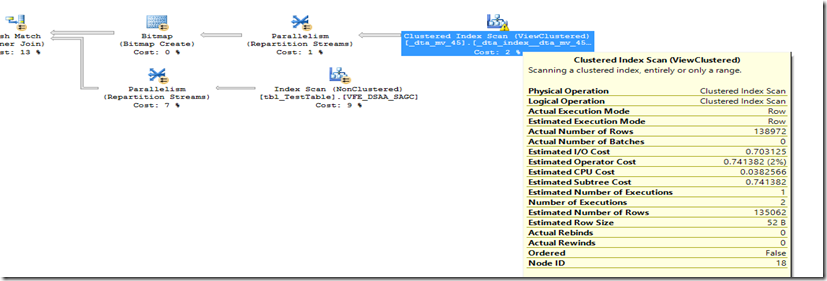
In the following two screenshots (figures 1 and 2). It’s the same plan. In this hash match operation, both builds and probes sides are parallelized. I am showing the scan for build input (scanning _dta_mv_45.dta_index_…). If you look closely, there are differences between the two. For figure 1, “number of executions” is 1. But for figure 2, “number of executions” is 2.
What this means is that the second plan (figure 2) was truly parallelized. But figure 1, it was a serial execution.
Figure 1
Figure 2
Another quick way to identify this is to open the .sqlplan file in a text editor and search for “RunTimeCountersPerThread “. If all you are seeing is RunTimeCountersPerThread Thread="0", then the plan was never parallelized. It executed serially. Here is an example where parallel threads were used.
<RunTimeCountersPerThread Thread="2" ActualRows="63125" Batches="0" ActualExecutionMode="Row" ActualEndOfScans="1" ActualExecutions="1" />
< RunTimeCountersPerThread Thread="1" ActualRows="75847" Batches="0" ActualExecutionMode="Row" ActualEndOfScans="1" ActualExecutions="1" />
< RunTimeCountersPerThread Thread="0" ActualRows="0" ActualEndOfScans="0" ActualExecutions="0" />
Note that: In this post, we also talked about how to use RunTimeCountersPerThread to help solve another issue related to reindexing.
Summary
When your query is compiled with parallelism, there is no guarantee that it will be executed with multiple threads. SQL Server can choose to execute the query with or without parallelism depending on current load of the system. If the server is very busy, this can create some ‘uneven’ response time for the same query with multiple executions. For highly concurrent system, you can reduce DOP to even out this type of variations. Or you can tune your query to reduce the need for parallelism and increase concurrency.

