How It Works: CMemThread and Debugging Them
| The wait type of CMemThread shows up in outputs such as sys.dm_exec_requests. This post is intended to explain what a CMemThread is and what you might be able to do to avoid the waits. The easiest way to describe a CMemThread is to talk about a standard Heap, HeapCreate and the options (with or without HEAP_NO_SERIALIZE). |
| Serialization is the a process of making sure only one thread of execution can execute a specific segment of code. The technique is most often talked about when talking about Windows Synchronization objects, such as, Mutexes and CriticalSections. |
| I think of it like the ticket dispenser. You get a ticket and wait your turn to be served. This just like a synchronization object, let’s look at an example. |
EnterCriticalSection // Wait for your turn dwVal++ // Do something that no other thread is allowed to do unless they have the ticket LeaveCriticalSeciton // Allow the next ticket owner to execute the code |
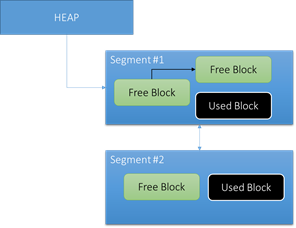
While the example is simplistic it quickly applies to a Heap. To allocate memory from a heap you would use HeapAlloc. The heap maintains various lists that can only be adjusted by one thread at a time or it would corrupt the lists. Let’s take a closer look at a high level heap design. |
 |
| The heap can be made up of multiple segments (different ranges of memory) that are linked together and each segment can have used and free blocks of memory. |
| When a HeapAlloc takes place the heap will locate a free block to support the allocation, update the free list, update used information and could even allocate a new segment if necessary to create more free memory. The maintenance of the list(s) are important to making sure the heap structures properly remain intact. If multiple threads attempt to modify the heap structures, in parallel, the structures will become damaged and lead to memory corruption. (Scribblers: https://blogs.msdn.com/b/psssql/archive/2012/11/12/how-can-reference-counting-be-a-leading-memory-scribbler-cause.aspx) |
| When you create a heap with the HEAP_NO_SERIALIZE option your code must make sure you don’t make calls to HeapAlloc, HeapReAlloc, HeapFree, Heap* by more than one thread at a time. This is usually done using something like a CriticalSection around all Heap* invocations. |
EnterCriticalSection HeapAlloc LeaveCriticalSection EnterCriticalSection HeapFree LeaveCriticalSection |
If you allow the Heap to maintain synchronization it will provide an efficient synchronization wrapper on your behalf so you don’t have additional synchronization mechanisms in your code. |
CMemObj SQL Server has a class named CMemObj that can be thought of as acting like a heap for the SQL Server developers. Instead of using HeapCreate the developer is calls CreateMemoryObject (often called a PMO – pointer to memory object) that is backed by the SQL Server memory manager. If you execute a select against sys.dm_os_memory_objects you can see the various memory objects currently in use by the SQL Server. The CMemObj is responsible for handling common activities such as Alloc, Free, ReAlloc, … as you would expect. |
| Think of the CMemObj as a HEAP_NO_SERIALIZE option for the SQL Server developer. It is not thread safe so the memory object should only be used by a single thread. |
CMemThread The CMemThread is the serialization wrapper around a CMemObj. For example the CMemThread::Alloc looks like the following. |
CMemThread::Alloc(…) { Enter SOS_Mutex // CMEMTHREAD WAIT TYPE AND ACCUMULATION OCCURS HERE CMemObj::Alloc(…) // __super::Alloc Leave SOS_Mutex } |
| The developer creates a memory object with the thread safe flag and SQL Server’s CreateMemoryObject will return a pointer to a CMemThread instead of the underlying CMemObj but overriding the necessary methods to provide the thread safe wrapper so the developer can share the memory object among any thread. |
| When you get a CMEMTHREAD wait you are observing multi-threaded access to the same CMemObj causing a wait while another thread is completing Alloc, Free, …. This is to be expected as long as the wait does not become excessive. When the number of waits and wait time start to become significant it can indicate that you need to release the pressure on the specific memory object. |
3 Types There are 3 types of memory objects (Global, Per Numa Node, Per CPU). For scalability SQL Server will allow a memory object to be segmented so only threads on the same node or cpu have the same underlying CMemObj, reducing thread interactions from other nodes or cpus, thereby increasing performance and scalability. |
| Many of the SQL Server memory objects are already segmented by node or cpu and provide scalability. Reference the following post for more details: https://blogs.msdn.com/b/psssql/archive/2011/09/01/sql-server-2008-2008-r2-on-newer-machines-with-more-than-8-cpus-presented-per-numa-node-may-need-trace-flag-8048.aspx |
bThreadSafe = 0x2, bPartitionedByCpu = 0x40, bPartitionedByNode = 0x80, -T8048 upgrade from by Node to by CPU (Can’t upgrade from global to by CPU) |
| Looking at the creation_options in sys.dm_os_memory_objects you can determine if the memory object is partitioned and if so to what degree, node or cpu. If the object is not partitioned (global) the trace flag has no impact on upgrading the partitioning scheme. |
Here is an example that shows the active memory objects that are partitioned by cpu.
select * from sys.dm_os_memory_objects where 0x40 = creation_options & 0x40 |
Will TF 8048 Help Reduce CMEMTHREAD Waits ? Here is a query that you can run on your box when you see high CMEMTHREAD waits. |
SELECT type, pages_in_bytes, CASE WHEN (0x20 = creation_options & 0x20) THEN 'Global PMO. Cannot be partitioned by CPU/NUMA Node. TF 8048 not applicable.' WHEN (0x40 = creation_options & 0x40) THEN 'Partitioned by CPU.TF 8048 not applicable.' WHEN (0x80 = creation_options & 0x80) THEN 'Partitioned by Node. Use TF 8048 to further partition by CPU' ELSE 'UNKNOWN' END from sys.dm_os_memory_objects order by pages_in_bytes desc |
| If you see the top consumers being of type 'Partitioned by Node.’, you may use startup, trace flag 8048 to further partition by CPU. Note: Trace flag 8048 is a startup trace flag. |
Removing Hot Memory Object · If the memory object is NUMA partitioned you may be able to use the trace flag to further partition the object and increase performance. · If the memory object is global or already partitioned by CPU you need to study and tune the queries impacting the memory object. |
|
Troubleshooting To troubleshoot this issue, we need to understand the code path that is causing contention on a memory object. |
| An example of this is the memory object used to track allocations for create table. The stack for which looks like the following: |
00 sqlservr!CMemThread<CMemObj>::Alloc 01 sqlservr!operator new 02 sqlservr!HoBtFactory::AllocateHoBt 03 sqlservr!HoBtFactory::GetFreeHoBt 04 sqlservr!HoBtFactory::GetHoBtAccess 05 sqlservr!HoBtAccess::Init 06 sqlservr!HoBtFactory::CreateHoBt 07 sqlservr!SECreateRowset 08 sqlservr!DDLAgent::SECreateRowsets 09 sqlservr!CIndexDDL::CreateRowsets 0a sqlservr!CIndexDDL::CreateEmptyHeap … |
| Starting a workload of create table(s) can cause the specific memory object contention as shown in the following stack trace. |
00 ntdll!NtSignalAndWaitForSingleObject 01 KERNELBASE!SignalObjectAndWait 02 sqlservr!SOS_Scheduler::Switch 03 sqlservr!SOS_Scheduler::SuspendNonPreemptive 04 sqlservr!SOS_Scheduler::Suspend 05 sqlservr!EventInternal<Spinlock<154,1,0> >::Wait 06 sqlservr!SOS_UnfairMutexPair::LongWait 07 sqlservr!SOS_UnfairMutexPair::AcquirePair 08 sqlservr!CMemThread<CMemObj>::Alloc 09 sqlservr!operator new 0a sqlservr!HoBtFactory::AllocateHoBt 0b sqlservr!HoBtFactory::GetFreeHoBt 0c sqlservr!HoBtFactory::GetHoBtAccess 0d sqlservr!HoBtAccess::Init 0e sqlservr!HoBtFactory::CreateHoBt 0f sqlservr!SECreateRowset 10 sqlservr!DDLAgent::SECreateRowsets 11 sqlservr!CIndexDDL::CreateRowsets 12 sqlservr!CIndexDDL::CreateEmptyHeap … |
| The call to sqlservr!SOS_UnfairMutexPair::LongWait, from a memory object, results in the CMEMTHREAD wait. You can use the following query to see wait information related to sessions and requests. |
select r.session_id,r.wait_type,r.wait_time,r.wait_resource from sys.dm_exec_requests r join sys.dm_exec_sessions s on s.session_id=r.session_id and s.is_user_process=1 |
session_id wait_type wait_time wait_resource ---------- --------------- ----------- --------------- 54 NULL 0 55 NULL 0 56 CMEMTHREAD 17062 57 CMEMTHREAD 17062 58 CMEMTHREAD 17063 59 CMEMTHREAD 17063 60 CMEMTHREAD 17062 |
| Use Extended Events and collect call stacks for all waits on CMEMTHREAD using an asynchronous bucketizer (or histogram in SQL Server 2012.) |
--First get the map_key for CMEMTHREAD wait type from the name-value pairs for all wait types stored in sys.dm_xe_map_values --NOTE :- These map values are different b/w SQL Server 2008 R2 and 2012 select m.* from sys.dm_xe_map_values m join sys.dm_xe_packages p on m.object_package_guid = p.guid where p.name = 'sqlos' and m.name = 'wait_types' and m.map_value = 'CMEMTHREAD' |
/* name object_package_guid map_key map_value ------------------------------------------------------------ ------------------------------------ ----------- --------------- wait_types BD97CC63-3F38-4922-AA93-607BD12E78B2 186 CMEMTHREAD */ --Create an Extended Events session to capture callstacks for CMEMTHREAD waits ( map_key=186 on SQL Server 2008 R2) --Create an Extended Events session to capture callstacks for CMEMTHREAD waits ( map_key=186 on SQL Server 2008 R2) |
IF EXISTS(SELECT * FROM sys.server_event_sessions WHERE name='XeWaitsOnCMemThread') DROP EVENT SESSION [XeWaitsOnCMemThread] ON SERVER CREATE EVENT SESSION [XeWaitsOnCMemThread] ON SERVER ADD EVENT sqlos.wait_info( ACTION(package0.callstack,sqlserver.session_id,sqlserver.sql_text) WHERE ( [wait_type]=(186)) --map_key for CMEMTHREAD on SQL Server 2008 R2) AND [opcode] = (1) AND [duration]> 5000 -- waits exceed 5 seconds ) ADD TARGET package0.asynchronous_bucketizer (SET filtering_event_name=N'sqlos.wait_info', source_type=1, source=N'package0.callstack') WITH (MAX_MEMORY=4096 KB,EVENT_RETENTION_MODE=ALLOW_SINGLE_EVENT_LOSS, MAX_DISPATCH_LATENCY=5 SECONDS,MAX_EVENT_SIZE=0 KB,MEMORY_PARTITION_MODE=NONE,TRACK_CAUSALITY=OFF,STARTUP_STATE=OFF) GO |
--Create second Xevent session to generate a mini dump of all threads for the first two wait events catpured for CMEMTHREAD IF EXISTS(SELECT * FROM sys.server_event_sessions WHERE name='XeDumpOnCMemThread') DROP EVENT SESSION [XeDumpOnCMemThread] ON SERVER CREATE EVENT SESSION [XeDumpOnCMemThread] ON SERVER ADD EVENT sqlos.wait_info( ACTION(sqlserver.session_id,sqlserver.sql_text,sqlserver.create_dump_all_threads) WHERE ( [wait_type]=(186)) --map_key for CMEMTHREAD on SQL Server 2008 R2) AND [opcode] = (1) AND [duration]> 5000 -- waits exceed 5 seconds AND package0.counter <=2 --number of times to generate a dump ) add target package0.ring_buffer WITH (MAX_MEMORY=4096 KB,EVENT_RETENTION_MODE=ALLOW_SINGLE_EVENT_LOSS, MAX_DISPATCH_LATENCY=5 SECONDS,MAX_EVENT_SIZE=0 KB,MEMORY_PARTITION_MODE=NONE,TRACK_CAUSALITY=OFF,STARTUP_STATE=OFF) GO |
| --Start the sessions
ALTER EVENT SESSION [XeWaitsOnCMemThread] ON SERVER STATE=START GO ALTER EVENT SESSION [XeDumpOnCMemThread] ON SERVER STATE=START GO |
When you collect data using the histogram target, you can acquire the un-symbolized call stack using the following query. |
SELECT n.value('(@count)[1]', 'int') AS EventCount, n.value('(@trunc)[1]', 'int') AS EventsTrunc, n.value('(value)[1]', 'varchar(max)') AS CallStack FROM (SELECT CAST(target_data as XML) target_data FROM sys.dm_xe_sessions AS s JOIN sys.dm_xe_session_targets t ON s.address = t.event_session_address WHERE s.name = 'XeWaitsOnCMemThread' AND t.target_name = 'asynchronous_bucketizer') as tab CROSS APPLY target_data.nodes('BucketizerTarget/Slot') as q(n) |
EventCount EventsTrunc CallStack -------------------------------------------------------------------------------------- 1 0 0x0000000001738BD8 0x0000000000E53F8B 0x0000000000E541C1 0x0000000000E529B6 0x0000000000FBF22A 0x0000000000F763CB 0x0000000000E578C4 0x0000000000E56DFA 0x0000000000F86416 … |
| Symbolize the stack addresses to function/method names using the ln command (Windows Debugger) and public symbols against the dump that was captured, as shown below. Note: The mini-dump capture is important because it contains the image versions, locations and sizes at the time the XEL capture took place. |
0:049> .sympath SRV*c:\symcache_pub*https://msdl.microsoft.com/download/symbols Symbol search path is: SRV*c:\symcache_pub*https://msdl.microsoft.com/download/symbols Expanded Symbol search path is: srv*c:\symcache_pub*https://msdl.microsoft.com/download/symbols 0:049> .reload /f sqlservr.exe 0:049> ln 0x0000000001738BD8 (00000000`00e5462c) sqlservr!XeSosPkg::wait_info::Publish+0xe2 | (00000000`00e5471c) sqlservr!SETaskSuspendingNotification 0:049> ln 0x0000000001738BD8;ln 0x0000000000E53F8B;ln 0x0000000000E541C1;ln 0x0000000000E529B6;;ln 0x0000000000FBF22A;ln 0x0000000000F763CB;ln 0x0000000000E578C4;ln 0x0000000000E56DFA;ln 0x0000000000F86416;ln 0x0000000000F7D922;ln 0x0000000000F87943;ln 0x0000000000F0083B;ln 0x0000000000F05D00 (00000000`00e5462c) sqlservr!XeSosPkg::wait_info::Publish+0xe2 (00000000`00e53d58) sqlservr!SOS_Scheduler::UpdateWaitTimeStats+0x286 (00000000`00e54174) sqlservr!SOS_Task::PostWait+0x4d (00000000`00e52890) sqlservr!EventInternal<Spinlock<154,1,0> >::Wait+0x1b2 (00000000`00f7628c) sqlservr!SOS_UnfairMutexPair::LongWait+0x104 (00000000`00e577f4) sqlservr!SOS_UnfairMutexPair::AcquirePair+0x46 (00000000`00e57858) sqlservr!CMemThread<CMemObj>::Alloc+0x6c (00000000`00e56ddc) sqlservr!operator new+0x1e (00000000`00f7d930) sqlservr!HoBtFactory::AllocateHoBt+0xba (00000000`00ef4a38) sqlservr!HoBtFactory::GetFreeHoBt+0x12a … |
| Once you have a symbolized stack you have a better understanding of the memory, contention point as well as the command(s) that are contributing to the contention. Using the trace flag or changing the query can remove the contention and improve SQL Server performance. |
Co-Author: Special Thanks and XEvent assistance Provided by: Rohit Nayak
Bob Dorr - Principal SQL Server Escalation Engineer