SQL Server 2012: RML, XEvent Viewer and Distributed Replay
Bob Ward, Keith Elmore and I establish goals for every release of SQL Server. A primary goal is always to make supporting the SQL Server easier. Not just in the sense of Microsoft support, although it does play a factor, but more so for you (the customer).
During SQL Server 2012 planning we spent a significant amount of time looking at the features of SQL Nexus, PSSDiag, Performance Dashboard and the RML utilities. In fact, at one time Keith and I were doing presentations to the development leads on what it would take to productize the RML utilities. The net of all this work was a series of work items, tasks, scenarios and requirements resulting in updates and enhancements to many areas of the product.
I am going to focus on XEvent Display for this post. However, if you read the SQL Server Books Online, Distributed Replay topic (https://msdn.microsoft.com/en-us/library/ff878183.aspx) you will see many of the RML capabilities have been extended to this part of the product.
Each version of SQL Server extends the on going supporatability, managability and troubleshooting capabilities. Over the years SQL Server has added DMVs such as sys.dm_exec_query_stats making it easy to walk up to any SQL Server and get information about the query patterns and performance statistics. This data has been exposed in a set of ‘SQL Server Performance Dashboard Reports’. Note, the SQL Server 2012 Performance Dashboard reports have been updated for SQL Server 2012 by Keith to take advantage of new DMV information.
XEvent Display (Faster Than A Speeding Bullet? Judge the Process For Yourself)
XEvent has been significantly extended in SQL Server 2012. The XEvent capabilities have been adopted outside the database engine and more than 400 events were add to the product. We wanted you to be able to take full advantage of these new capabilities. This included providing a UI, similar to the SQL Profiler for the .TRC capabilities, for XEvent.
Designing a UI for XEvent was not trivial. The advanced capabilities of XEvent make display more than a simple grid. Some of the ideas are still, to-be-implemented, but the foundation provides some rich capabilities for all of us.
As I mentioned utilities such as RML played key roles in defining the scenarios and requirements for SQL Server 2012. For as long as RML has been available there has always been a way to determine the top ## queries by CPU, Reads, Write, … in order to determine what is impacting the key resource. As I mentioned you can see the direct correlation to the early RML capabilities for top ## in places such as sys.dm_exec_query_stats. You can see the footprints of this in the XEvent display capabilities as well.
Some of the most costly support scenarios are Blocking, Deadlocking, and Query Performance. For this post I am going to show you how the XEvent Display implemented RML top ## scenarios, right in the shipping product.
The common process for using RML or working with support to troubleshoot a performance problem is to
- Capture a trace (.TRC) of the statements. This is often down with a PSSDiag package when you work with support.
- Run the captured information through ReadTrace (SQLNexus wrapper perhaps)
- Review the reports provided by RML in Reporter or as directly exposed in SQLNexus
It is well known that .TRC format is 10+ years old and becoming outdated. The XEvent capabilities are designed to avoid impacting performance while capturing, providing rich data points, enhanced event predicates and many features that the .TRC format does not handle as well.
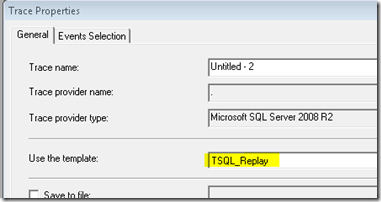
Instead of using the .TRC replay capture use the XEvent Query Detail Tracing.
| TRC Capture | XEVENT Capture |
 |
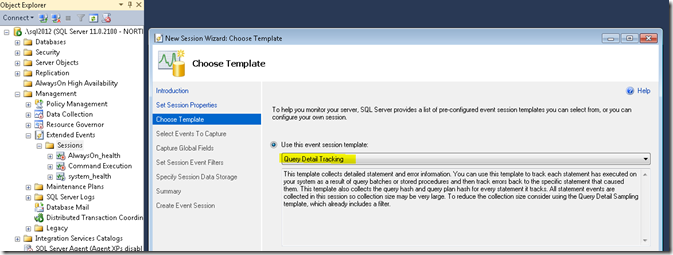 |
I always get the look ‘Big Deal’, so I use a different template what does that gain me? For starters XEvent is many times faster with a tiny performance impact compared to its .TRC predecessor. It also contains some key event columns that Keith, Bob and I worked hard to make sure was part of the statement level events. (QUERY HASH)
One of the problems .TRC has is that there is no way, built into the product, to group the same query into a bucket. If I issued select * from authors where au_lname = ‘DORR’ and select * from authors where au_lname = ‘ELMORE’ there was no way to correlate them without using RML to parse and normalize the query text into a hash id. SQL Server already has the query_hash, query_plan_hash and similar data points that can provide the grouping capabilities. Capturing the statement events in XEvent allows you to capture the hash ids used by the SQL Server.
Now allow me to show you the power of the new UI capabilities so you can see the ‘Big Deal!’
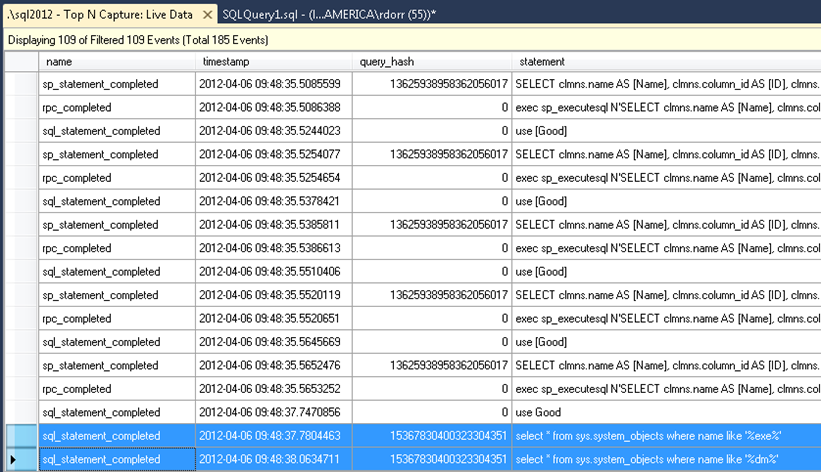
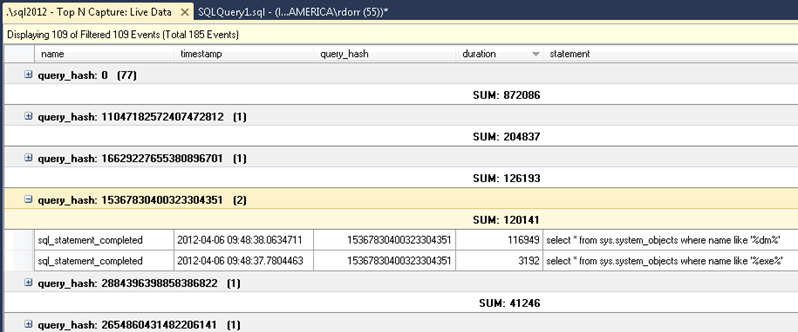
I ran the XEL capture and added the query_hash and statement columns to the view in SSMS. I specifically changed the where clause of my query to show that the query_hash is the same for varied query text.
Now I want to see the TOP N capabilities in action.
- Add the ‘Duration’ column to the view.
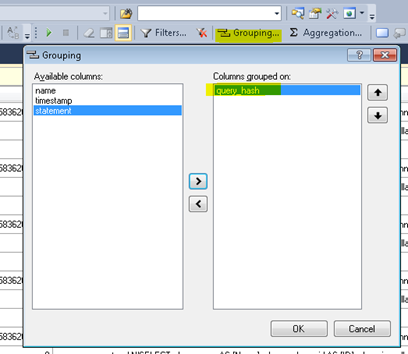
- Select ‘Grouping’ and add the query_hash as the grouping column.
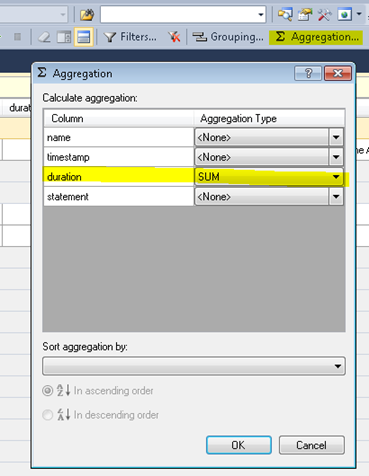
Select Aggregation… and SUM by Duration.
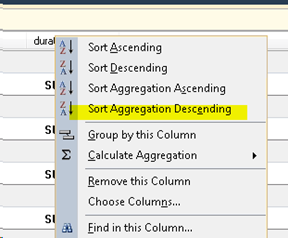
Right mouse on the duration column and select to sort by the aggregation in descending order.
You just achieved TOP N statements (same query_hash) sorted by sum of duration, descending order. You can just as easily select to see the AVG, or by CPU, by Reads, … another resource required to troubleshoot the issue.
Notice that my queries grouped together even with the varied value in the where clause.
You have the TOP N views from RML available in the XEvent Display right in SSMS.
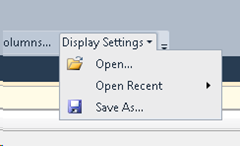
However, that is a bit of work to setup the view each time you open a trace. Another feature we were able to facilitate is the ability to save the display settings and apply them. You can create your favorite display settings and same them (usually 500 < byte file). Then open the display settings and it will apply the columns, sorts, grouping, … and other aspects to the XEL data, returning you to the customized view of your data that you prefer.
Furthermore, the XEL data can be exported to a TABLE, filtered XEL file or CSV and used in applications such as Microsoft Excel. Folks like Keith, Bob and I are starting to use PowerPivot and PowerView to chart and analyze XEL data as well.
Support Advantage ~= Your Advantage
As we all gain experience with XEL captures the goal it to remove the FTP data exchange with Microsoft support. Today you capture the PSSDiag or .TRC, upload large .TRC files to Microsoft, etc… Instead of doing this we can (or you can use with your peers as well) provide you with the customized XEL capture definition and XEL Display View (couple of small TXT files quickly over e-mail). Allow you to capture the data and apply the view without needing to copy the captured data around.
Now the discussion moves directly to the issue at hand instead of lengthy FTP or other data exchanges.
Try it out, I think you will find additional features in the XEL Display UI that provide many of the features you are used to with SQL Performance Dashboard, SQLNexus and RML.
Bob Dorr - Principal SQL Server Escalation Engineer

