Inappropriate usage of high isolation level isn’t just about blocking when it comes to performance
Normally when you see high isolation level such as SERIALIZABLE is used, your natural instinct tells you that it may cause blocking or deadlocking. But you may be surprised to know that it actually can cause high CPU as well. When you use SERIALIZABLE or REPEATABLE READ isolation levels, even shared locks can’t be released until the transaction is committed or rolled back. This can cause large number of locks being held at any given time. Granted that inappropriately managing transaction in read committed isolation level can also cause large number of locks being held, this generally accumulates locks other than shared locks.
Large number of locks at server level can cause a query with exact same plan consume more CPU than normal. The reason is that in order for SQL Server to grant a lock request, it has to traverse internal structures to figure out who owns what. When number of locks becomes large, it takes time and CPU to figure out who owns what even the request may not have any conflict and eventually results in a grant.
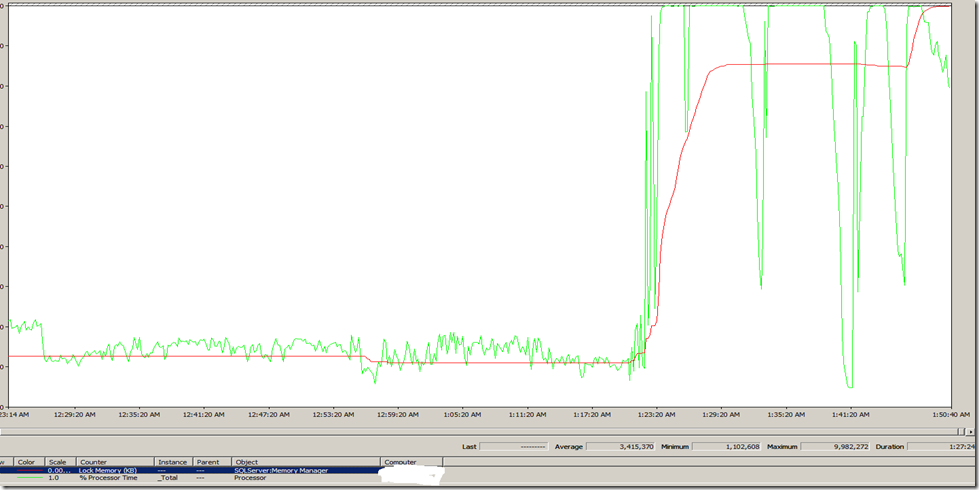
Below is a chart of data from an actual customer. The green line is lock memory (KB) and red line is total CPU (%). That’s right! Lock memory reached to about 9.9GB at one point. During the period of high lock memory, you see sustained period of 100% CPU. There was some dip in CPU periodically. Those were actual times of blocking. But during periods with 100% CPU, we noticed a particular query would consumed 30 seconds of CPU per execution whereas it only consumed 0.3 seconds of CPU with exact same query plan. This is because of high number of locks. As more request piled in, server became totally non-responsive.
Upon further look, we discovered that the procedure used SERIALIZABLE level and there were insufficient indexes. As a result, every execution would need 1/4 million locks being held until end of the procedure execution. So the system would work fine with a few concurrent executions. But as more concurrent requests come in, this was no longer linear increase of CPU consumption. It’s actually exponential because more and more locks were being held. Long term, this application needs to evaluate if SERIALIZABLE is truly needed. Lucky enough, we were able to find a good index and dramatically reduced lock required.
Symptoms of this type of issue
- Blocking/deadlocking
- High CPU
- Out of memory errors
- A query normally takes small amount of CPU now takes much more CPU even plan remains the same.
- Non-responsive server
Identification of this type of issue
There are several ways you can identify this issue.
- use perfmon to look at lock memory under SQL Server:Memory Manager. If you see this value reaching 1 GB, you should really pay attention.
- exec sp_lock will enumerate a locks for the server
Solution
- Evaluate if you truly need high isolation level.
- Evaluate individual query that holds large number of locks. You may be able to tune the query by adding indexes to reduce number locks required
- also note that incorrectly managing transactions that accumulate large number of locks (even with read committed isolation level, not just SERIALIZABLE or REPEATABLE READS) can cause exact same behavior.
Jack Li | Senior Escalation Engineer |Microsoft SQL Server Support
