How It Works: Timer Outputs in SQL Server 2008 R2 - Invariant TSC
 |
I would love nothing more than to take you back to my high-school days running the 440 yard hurdles (yes yards not meters) where timing was done with a stop watch (you know the old, moving dial style) but timers on the PC don't allow that simplicity. I have discussed the timing behavior is SQL Server in previous blogs and it is time to discuss timing behaviors again as SQL Server 2008 R2 has been updated.
I normally don't reference material outside the Microsoft website but this link is one of the best I have found that briefly explains the entire history of PC timers. Click Here |
If you are like me it is a bit confusing as to what timer you are looking at and Windows Server 2008 R2 and SQL Server 2008 R2 took steps to eliminate the confusion once and for all.
SQL Server 2008 R2 attempts to detect when the system supports the invariant-TSC counter. Newer processors are being designed to tick the RDTSC value at a constant rate no matter what the power settings or state might be. This means there is a high resolution counter, with constant tick rate available to the system. The invariant TSC does not exhibit the issues I have outlined about the variant TSC (SQL Server 2005 RTM) in previous blog posts.
In Windows 2008 R2 (Windows 7 and newer OS Versions * ) the QueryPerformanceCounter may be based off the invariant TSC counter making a call to QueryPerformanceCounter lightweight and accurate. Windows does not have an API to indicate what source QueryPerformanceCounter is using at this time so SQL Server 2008 R2 startup times the invocation of QueryPerformanceCounter (10 times) and when it exhibits repeated, small cycle behavior (< 600 cycles) the QueryPerformanceCounter will be used to accept invariant TSC timings instead of the GetTickCount/timeBeginPeriod interrupt timing behavior. If the timing exceeds 600 cycles the multi-media timer behavior of SQL Server is used instead.
Note: Windows is exposing the timer source API for QueryPerformanceCounter in a Windows 2008 R2 based fix so the timing source determination by SQL Server will be replaced with the API call in a future build. Target releases are the SP1 of Windows 2008 R2 and SQL Server 2008 R2.
When I express the previous information to others I get inquisitive looks with the 'what does this mean to me?' question and rightfully so. What is means is that Windows 2008 R2 and SQL Server 2008 R2 try to select the counter that will be accurate with the best precision. If the invariant TSC is not present then the interrupt timer (Multi-Media) at a granularity of 1ms instead of micro-seconds will be used. When the invariant TSC is available accurate, micro-second timings are possible.
The following table refractors the table from the previous blog post to include the SQL Server 2008 R2 and Windows 2008 R2 behaviors.
| Operating System (All Platforms) | SQL Version / Timer | ||||||||||||||||
| Windows 2003Windows 2003 R2Windows 2008 |
|
||||||||||||||||
| Windows 2008 R2 |
|
** Selection of Multi-Media timer can be altered using trace flags 8049 or 8038 as described in the SQL Server 2008 R2 section above.
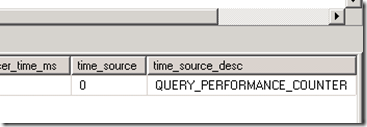
Older systems showing QUERY_PERFORMANCE_COUNTER as the timer source on Windows 2008 R2
The invariant TSC is implemented in newer CPUs but it is possible for Windows 2008 R2 to detect that the CPU is not registered to drop into deep sleep states. When this is the case the TSC can be considered invariant and Windows will use the RDTSC as a valid source for QueryPerformanceCounter timings.
The QueryPerformanceCounter source is determined at boot time so when the SQL Server service starts the timer source has been established. The only time this is not the rule is when running on a machine that can switch from AC to DC power (a laptop). When this occurs the power scheme can change and allow deep sleep states. The QueryPerformanceCounter source will dynamically change to a safer timer (Hpet, PMTimer, …) but users of the QueryPerformanceCounter API won't be directly impacted as the proper QueryPerformanceFrequency and such metric outputs are encapsulated by the API. The only side effect may be a slight decrease in performance when calling the QueryPerformanceCounter API.
Mutli-Media Timer in a Virtual Machine
When you are running SQL Server in a virtual machine (Hyper-V, VMWare, …) a call to QueryPerformanceCounter vs the interrupt timer (Multi-media timer: GetTickCount, timeGetTime, …) can yield different results. I found this working with a customer showing entries into sys.dm_exec_procedure_stats for last_elapsed_time were noticeably smaller than the RPC:Completed event. There are several reasons for the variance but one of the reasons is that the interrupt timer is virtualized (can queue and lag) and the QueryPerformanceCounter is generally working with the hardware in a more direct way.
I built a console application that would grab the GetTickCount (timeGetTime), QueryPerformanceCounter and GetSystemTime on regular intervals. Under heavy CPU stress the interrupt based timer (GetTickCount, …) would lag ~30ms behind the reported QueryPerformanceCounter timings. Some of this is noise due to common context switching and some could be the virtual interrupt queuing.
Here is my snippet from the response I sent to the customer.
· sys.dm_exec_query_stats only shows statement level events that are cached and not all statements ever run on the server. (Ex: create index will not appear in the DMV)
· sys.dm_exec_procedure_stats shows execution time of the procedure but does not include the batch cleanup time, time for streaming the final OUTPUT parameters, result status and such activity. Larger output parameters could influence the delta between the last_elapsed_time and the RPC:Completed event.
· Interrupt timing may not be completely accurate in a virtual environment
· Profiler duration is closer to the time it takes to submit and complete the command (including the cleanup activity, output parameter streaming and such activity). The RPC and Batch completed events are really what you want to see in a DMV but we don’t have that DMV. You want a sys.dm_exec_batch_stats that shows arrival to final result send duration and statistics.
· The *worker* time values in the stats DMVs is the potential SOS scheduler time and can be loosely equated to CPU but that is not always the case and it does not directly align to some of the other CPU outputs that come from GetThreadTimes API output
· The Profiler timer is QueryPerformanceCounter based and the stats DMVs are commonly interrupt timer based. SQL Server 2008 R2 may use QPC for stats tables if the system supports an invariant RDTSC timer.
· GetDate uses a 1 sec sync with the OS and inside that second the interrupt timer movement is used to quickly calculate the offset within the second.
Bob Dorr - Principal SQL Server Escalation Engineer
