How It Works: Almost Everything You Wanted To Know About The SQL Server (2005, 2008) Performance Counter Collection Components
I will be posting a troubleshooting companion to this 'How It Works' that outlines the associated troubleshooting steps for SQL Server base performance counter collection issues. This post attempts to highlight the various components of the SQL Server performance counter library so you have the foundational information to better troubleshoot problems in this area of the SQL Server product.
Performance Counter Access Paths
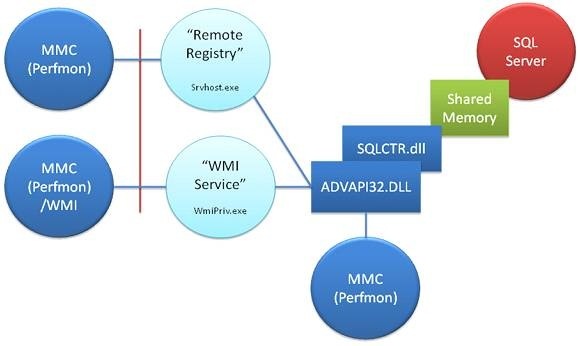
The HKEY_PERFORMANCE_DATA is retrieved using the PerfLib components exposed in AdvApi32.dll. The following diagram shows the Windows Performance Monitor but any application can use the APIs and engage the same collection paths.
When collecting remote either the "Remote Registry" service is used or the "Windows Management Instrumentation" service when the /WMI switch is used. When collecting locally the AdvApi32.dll is loaded into the collection process address space.
Performance Library Registry Key
Reference: https://msdn.microsoft.com/en-us/library/ms803837.aspx
Performance counter collection information is placed in the Windows Registry and any application exposing performance counters must provide a Services\Performance Key.
[HKEY_LOCAL_MACHINE\System\CurrentControlSet\Services\<<service name>>\Performance]
Reference: https://msdn.microsoft.com/en-us/library/ms893162.aspx
The Service\Performance key contains value members indicating the DLL to be used, entry points in the DLL and other facets.
Shown below are some of the key entries from my SQL Server 2005 named instance (MSSQL$SQL2005).
[HKEY_LOCAL_MACHINE\SYSTEM\CurrentControlSet\Services\MSSQL$SQL2005\Performance]
"Library"="sqlctr90.dll" <----------------------------- The performance counter DLL that exposed the Open, Collect and Close entry points
"Open"="OpenSQLPerformanceData1"
"Collect"="CollectSQLPerformanceData1"
"Close"="CloseSQLPerformanceData1"
"PerfIniFile"="perf-SQL2005sqlctr.ini" <----------------------------- INI file used to load the Performance TITLES database
Shown here is a SQL Server 2008 registration.
[HKEY_LOCAL_MACHINE\SYSTEM\CurrentControlSet\Services\MSSQL$SQL2008\Performance]
"Library"="perf-MSSQL$SQL2008-sqlctr10.0.1600.22.dll" <----------------------------- The performance counter DLL that exposed the Open, Collect and Close entry points
"Open"="OpenSQLPerformanceData"
"Collect"="CollectSQLPerformanceData"
"Close"="CloseSQLPerformanceData"
"PerfIniFile"="perf-MSSQL$SQL2008sqlctr.ini" <----------------------------- INI file used to load the Performance TITLES database
"Disable Performance Counters"=dword:00000000
Disable Performance Counters is an optional value. When the key is missing or the value is 0 the counters are considered enabled. When the value is set to 1 the counters are disabled; the performance library will not be loaded and the counters remain unavailable. If a performance library detects a problem with the performance counters it can automatically disable the library. An example would be a library which kept generating exceptions (crashing).
When I first started working at Microsoft in 1994 the performance counters were loaded in the WinLogon process when accessed remotely. SQL Server has a bug that would cause an exception. Exceptions in WinLogon are considered FATAL to the operating system and a blue screen would be generated. I am happy to say that since 1994 this designed has changed to move the remote performance counter loading into srvhost.exe and protect the process by catching problems and only disabling the counters.
Shown below is an Application, event log entry where I forced a crash of the SQL Server performance counters to simulate a problem, resulting in a Disable Performance Counters setting of 1.
Event Source: Perflib Provider: Microsoft-Windows-Perflib
Message: The Collect Procedure for the "MSSQL$SQL2008" service in DLL "C:\Windows\system32\perf-MSSQL$SQL2008-sqlctr10.0.1600.22.dll" generated an exception or returned an invalid status. The performance data returned by the counter DLL will not be returned in the Perf Data Block. The first four bytes (DWORD) of the Data section contains the exception code or status code.
UserData: 050000C000000000
The user data is byte swapped so the outcome is really 0xc0000005 or Access Violation which is what I caused by setting pointer to NULL.
Timeouts And Configuration Flags
The Performance tree can contain OpenTimeout and CollectTimeout values. These entries indicate how long the entry point is expected to execute before a timeout is logged in the Application Event log. If the PerfLib\Configuration Flags value requires it, the counter library will also be disabled.
Configuration Flags: [HKLM\SOFTWARE\Microsoft\Windows NT\CurrentVersion\Perflib]
Bit value |
Test setting |
0x0 |
Use default test behavior. |
0x1 (1 binary) |
Do not test for data buffer alignment errors. (These are common errors that are not usually critical.) Perform all other tests. |
0x2 (10 binary) |
Do not disable counters. Perform all tests, but if a counter generates a function error or a program exception, record a message in the Application Log. |
0x4 (100 binary) |
Do not time procedure calls or perform buffer integrity tests. |
0x8 (1000 binary) |
Disable counters if their procedure calls are slow. (Non-trusted counter DLLs only.) |
0x10 (10000 binary) |
Collect debugging data. |
Typically the registry keys are not present and use the default. These are REG_DWORD milli-second values and the default value is handled by the OpenProcedureWaitTime located under the PerfLib key containing a default value of 10 seconds.
Reference: https://www.microsoft.com/technet/prodtechnol/windows2000serv/reskit/regentry/94221.mspx
Linkage
The registry location [HKEY_LOCAL_MACHINE\SYSTEM\CurrentControlSet\Services\<<service name>>\Linkage] contains the Export value. The value of Export should be a MULTI_REG_SZ value containing the instance name. Shown below is an example of my SQL 2005 (MSSQL$SQL2005) instance.
[HKEY_LOCAL_MACHINE\SYSTEM\CurrentControlSet\Services\MSSQL$SQL2005\Linkage]
Export: MULTI_REG_SZ = "SQL2005"
Reference: https://support.microsoft.com/kb/296481
The reason the Linkage is important is that the data in the Export key is passed to the Open entry point, allowing the SQL Server performance counter library to establish the proper context to the instance. If this key is incorrect the SQL Server performance counter library is unable to open the proper named objects for performance data export to the perflib.
Titles Database
The titles database contains the counter name, instance id and description that is used for display in utilities such as Windows Performance Monitor.
TITLES Database: HKEY_LOCAL_MACHINE\Software\Microsoft\Windows NT\CurrentVersion\PerfLib\<<country code>>
The counter key holds the instance id, name pairs and the help key the associated descriptive text.
Counter |
Help |
2 System |
3 The System performance object consists of counters that apply to more than one instance of a component processors on the computer. |
4 Memory |
5 The Memory performance object consists of counters that describe the behavior of physical and virtual memory on the computer. Physical memory is the amount of random access memory on the computer. Virtual memory consists of the space in physical memory and on disk. Many of the memory counters monitor paging, which is the movement of pages of code and data between disk and physical memory. Excessive paging, a symptom of a memory shortage, can cause delays which interfere with all system processes. |
6 % Processor Time
|
7 % Processor Time is the percentage of elapsed time that the processor spends to execute a non-Idle thread. It is calculated by measuring the duration of the idle thread is active in the sample interval, and subtracting that time from interval duration. (Each processor has an idle thread that consumes cycles when no other threads are ready to run). This counter is the primary indicator of processor activity, and displays the average percentage of busy time observed during the sample interval. It is calculated by monitoring the time that the service is inactive, and subtracting that value from 100%. |
The TITLES database is important to display in utilities such as the Windows Performance Monitor and the instance ids are used when the Collect function is invoked. Collect can be invoked with 'Global' meaning return all counters from the specified library or the instance id indicating which counter instance to return. If the TITLES database becomes damaged collection won't work correctly.
Reference: https://msdn.microsoft.com/en-us/library/ms893221.aspx
The lodctr.exe and unlodctr.exe utilities are used to repair the TITLES database.
unlodctr <<INSTANCE NAME Ex: MSSQL$SQL2008>>
lodctr /T:<<COUNTER INI FILE>>
The counter instance name will match your SQL Server service, instance name. For example my SQL2005 instance is MSSQL$SQL2005 and when running lodctr specify the /t parameter because the SQL Server performance library is considered a TRUSTED implementation.
Note: Running unlodctr removes the entries from the TITLES database and the First/Last counter values from the <<Service name>>Performance key but it does not update the Close, Collect, Open or Library key. If the path or entry ports are incorrect then lodctr/unlodctr will not correct these registry values.
INI File
The counter ini file contains sections outlining the registration details. For example the drivername and symbolfile appear as shown in perf-SQL2005sqlctr.ini for my MSSQL$SQL2005 instance.
Note: There may be sqlctr.h and sqlctr.ini in the BINN directories. These are templates, be sure to use the proper file as indicated under the ServiceName\Performance registry.
[info]
drivername=MSSQL$SQL2005
trusted=
symbolfile=C:\Program Files\Microsoft SQL Server\MSSQL.1\MSSQL\Binn\sqlctr.h
Variable |
Description |
DriverName |
The name of the performance key created under the HKEY_LOCAL_MACHINE\SYSTEM\CurrentControlSet\Services key. |
SymbolFile |
An .h file containing symbolic offsets of counters. The performance DLL uses the offsets in this file with the First Counter and First Help registry values to determine the indexes of the various counters and counter objects. |
Reference for using lodctr and reasons why it might not load counters: https://msdn.microsoft.com/en-us/library/ms894317.aspx
The specific, counter INI file is located in the instance BINN directory as PerfIniFile key shows under the ServicesName\Performance key, as outlined previously.
Reference: https://support.microsoft.com/kb/933945
First Counter and First Help under the <<Service Name>>\Performance Key
The counters are the counter starting positions in the TITLES database. When lodctr processes the .INI file the matching .H file is referenced.
Here is an example from my MSSQL$SQL2008 installation of how to match the INI and .H file to the TITLES database registration.
First Counter: 3ba2
Last Counter: 3eda
First Help: 3ba3
Last Help: 3edb
BINN\perf-MSSQL$SQL2008sqlctr.ini
[info]
drivername=MSSQL$SQL2008
trusted=
symbolfile=C:\Program Files\Microsoft SQL Server\MSSQL10.SQL2008\MSSQL\Binn\sqlctr.h
[text]
BUFMGR_OBJECT_009_NAME=MSSQL$SQL2008:Buffer Manager
BUFMGR_OBJECT_009_HELP=Statistics related to SQL Servers buffer manager
...
RPS_TARGET_MEMORY_009_NAME=Target memory (KB)
RPS_TARGET_MEMORY_009_HELP=Target amount of memory in kilobytes the resource pool is trying to attain based on the settings and server state.
BINN\sqlctr.h
#define BUFMGR_OBJECT 0
...
#define RPS_MEMORY_GRANT_TIMEOUT 824
TITLES Database Instance Id Calculation
Counter Instance Id Calculation = First Counter + (.H offset value)
Help Instance Id Calculation = First Help + (.H offset value)
So 0x3ba2 (15266) should be the BUFFER_OBJECT for the MSSQL$SQL2008 instance and 0x3ba2+824 (16090) should be the RPS_MEMORY_GRANT_TIMEOUT object.
15266
MSSQL$SQL2008:Buffer Manager
16060
MSSQL$SQL2008:Resource Pool Stats
...
16090
Memory grant timeouts/sec
Calculate the help counter entries using the same formula and the help counter first and last values.
Counters Not Listed In Perfmon
For testing purposes I replaced my sqlctr.h from SQL 2008 with one from SQL 2005 and attempted to lodctr using the SQL 2008 INI file. I got a series of messages indicating that the key is not formatted correctly and the information was loaded, based on the SQL 2005 values into the TITLES database. The counters don't show up in Performance monitor listings now.
The Open Procedure for service "MSSQL$SQL2008" in DLL "C:\Windows\system32\perf-MSSQL$SQL2008-sqlctr10.0.1600.22.dll" failed. Performance data for this service will not be available. The first four bytes (DWORD) of the Data section contains the error code.
<param1>MSSQL$SQL2008</param1>
<param2>C:\Windows\system32\perf-MSSQL$SQL2008-sqlctr10.0.1600.22.dll</param2>
<binaryDataSize>8</binaryDataSize>
<binaryData>F303000000000000</binaryData>
Byte swapping the data value you get 0x000003F3 (1011) - The configuration registry key could not be opened, indicating the index could not be located in the TITLES database.
Restarting the SQL Server Service when the TITLES database is in this state does not present any error. The shared memory regions are created on the binary need of the SQL Server so SQL Server itself is not effected but performance collection facilities have the wrong data and can't properly list the counter values.
PerfLib (ADVAPI32.dll)
The perfLib loads the 'Library' and calls GetProcAddress to obtain the Open, Collect and Close entry points from the DLL. The historical collection method uses the virtual registry key HKEY_PERFORMANCE_DATA with the RegQueryValueEx API. This loads the perflib component (hosted in advapi32.dll) to accomplish the counter loading and collection work.
The event log sources associated with the performance library actions are 'PerfLib' and 'LoadPerf'. Using the event log and these sources can provide you with in depth troubleshooting details.
MMC.exe and PERFMON.MSC (Local and Remote)
When using the MMC.exe (perfmon.msc snap-in), or similar collector, on the local computer the performance library work is done in the process space of the MMC.exe.
When collecting the performance counters from a remote client the RegQueryValueEx API is used against the target system. On the target system the same registry lookups take place but instead of using the performance library directly they are typically loaded in and svchost.exe supporting the remote registry lookup activity.
SQL Server Shared Memory
The SQL Server counters use shared memory regions to exchange data with the performance library. The figure shown here outlined the basic components.
When SQL Server starts up it attempts to create/open the shared memory regions and named mutex. SQL Server then proceeds to validate the size and security attributes to make sure the regions are viable for producing performance counters. If there are any problems error information is written in the SQL Server error log and the Application event log.
An example of a problem would be a security violation. For example, when MMC.exe as active it holds the object references to the shared memory and named objects. If the SQL Server service is restarted it will open, not create, the objects because they already exist due to the external reference count MMC.exe holds. If you changed the SQL Server Service Account and restart SQL Server the security of the original regions is different from that of the new service account context. To correct such a problem make sure all monitoring tools are terminated and restart SQL Server so the shared memory and named events can be created with the newest security credentials.
Some of the naming conventions used.
Mutex Naming: SQL_PERF_DATA_MUTEX$Instance
Shared Memory Regions: SQL_90_MEMOBJ_INSTANCE_#### ... where #### is the region counter from 0 to 100
Counter Library: Contains "sqlctr" in the name
By default the PerfLib may call the Close entry point if no collection has occurred in the last 30 seconds which can be controlled by the PerfLib\Library Unload Time (REG_DWORD) milli-second value and becomes global to all counter libraries.
The <<Service Name>>\Performance key can contain the Keep Library Resident value and when set to the value of 1 prevents Close activity because of timeout. If this is enabled for the SQL Server performance counter library the memory resident behavior can be elongated making it easier to cause the condition previously described.
Wow64 Installations
The WOW installations of SQL Server are 32 counter DLLs so collecting and monitoring them from a 64 bit Windows Performance Utility is not possible or supported. To monitor such counters you must start the 32 bit Windows Performance Monitor or other utility. To monitor 32 bit SQL Server installations on a 64 bit operating system use the 32 bit version of Windows Performance Monitor.
Starting a 32 bit Windows Performance Monitor session: mmc.exe /32 perfmon.msc
The performance DLLs installed and the services registry keys are critical to understanding what you can and cannot collect from WOW installations. There is only a single service key for the instance in the registry. Unlike other locations in the registry that support the WOW6432Node services are singular on the system. For a instance named SQL2008 the service key is MSSQL$SQL2008. This key contains the pointer to the performance library details, including the performance library DLL.
SQL Server places the performance counter libraries in the System32 location and allows loading via the standard path searches. In the case of a 32 bit installation (in the WOW) on a 64 bit OS the sqlctr*.dll is placed in the Windows\SysWow64 directory.
So when you run Perfmon or WMI they are 64 bit applications and attempt to load the counter from Windows\System32. This will be a 64 bit counter DLL and allow access to SQL Server counters. However, for a WOW only installation of SQL Server the performance dll is located in Windows\SysWow64 and won't be loaded. Even if the DLL is found in a path search the 64 bit application is not allowed to load a 32 bit binary and will fail.
So you say: "Just copy a x64 sqlctr*.dll into the Windows\System32 and it should work." - Wrong
- This is not supported by Microsoft
- The Services key contains a library validation code which is a checksum of the binary and will be incorrect as it was loaded for the 32 bit version.
- If you use unlodctr/lodctr to correct the validation code to match that of the 64 bit DLL 32 bit collection will now fail as the validation code is not the same for the 32 bit version of the DLL
- Failures to access the DLL result in 'Disable Performance Counters = 4' so it is likely that shortly after you get this working the performance counters will get disabled from a failed access attempt.
- SQL won't know you copied this and can't apply the proper updates to the files
SQL 2000: Does not have a x64 build of the performance library. SQL 2000 only shipped x86 and IA64 builds so you can't accomplish this.
SQL 2005: Ships the sqlctr90.dll so you can get this to work but as mentioned above it will be problematic.
SQL 2008: Does not use sqlctr100.dll but instead copies it to the system path and renames it to match the instance name and version. So even if you copy sqlctr100.dll to the system path it still won't work as expected.
Adding WMI to the mix makes this a bit more cloudy. When collecting counters using the WMI interfaces the SQL Server performance counter library is loaded in the WmiPrv*.exe process. This is a 64 bit process and as such only loads 64 bit counter libraries. Attempting to collect SQL Server counters on an x64 operating system with only a WOW SQL Server (x86) instance installed using WMI can't expose the SQL Server counters.
WMI Counter Access Using C++ for SQL Server Counters
The following link outlines how to use the WMI interfaces to collect performance data. https://msdn.microsoft.com/en-us/library/aa384740(VS.85).aspx
I modified this to collect a SQL Server performance counter. While attempting to do this I found it hard to determine the raw name of the SQL Server object needed when calling AddObjectByPath.
Using Wbemtest.exe you can determine the instance name syntax and available properties and other options.
1. Start Wbemtest.exe on the machine that produces the performance counters
2. Press the Connect button and use root\cimv2
![image_thumb[1]](https://msdntnarchive.blob.core.windows.net/media/TNBlogsFS/BlogFileStorage/blogs_msdn/psssql/WindowsLiveWriter/HowItWorksAlmostEverythingYouWantedToKno_D6D0/image_thumb%5B1%5D_2.png)
![image_thumb[3]](https://msdntnarchive.blob.core.windows.net/media/TNBlogsFS/BlogFileStorage/blogs_msdn/psssql/WindowsLiveWriter/HowItWorksAlmostEverythingYouWantedToKno_D6D0/image_thumb%5B3%5D_2.png)
3. Press the Enum Classes Button, select recursive and press the OK button.
![image_thumb[5]](https://msdntnarchive.blob.core.windows.net/media/TNBlogsFS/BlogFileStorage/blogs_msdn/psssql/WindowsLiveWriter/HowItWorksAlmostEverythingYouWantedToKno_D6D0/image_thumb%5B5%5D_2.png)
4. Scroll down to a Win32_PerfRawData_<<SQL SERVER COUNTER>> section of the query output. If the SQL Server counters are not present the WMI database registration is out of sync or you have a WOW instance without a 64 bit performance counter library available.
![image_thumb[9]](https://msdntnarchive.blob.core.windows.net/media/TNBlogsFS/BlogFileStorage/blogs_msdn/psssql/WindowsLiveWriter/HowItWorksAlmostEverythingYouWantedToKno_D6D0/image_thumb%5B9%5D_2.png)
5. Double click the counter group to display object details. Here you can see how the counter is registered, data sizes, properties and other facets.
![image_thumb[12]](https://msdntnarchive.blob.core.windows.net/media/TNBlogsFS/BlogFileStorage/blogs_msdn/psssql/WindowsLiveWriter/HowItWorksAlmostEverythingYouWantedToKno_D6D0/image_thumb%5B12%5D_2.png)
6. Click the Instances button to get the raw name.
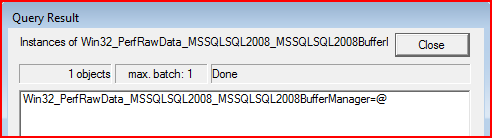
======================================================================================
// WMIPerf.cpp : Defines the entry point for the console application.
//
#include "stdafx.h"
#define _WIN32_DCOM
#include <iostream>
using namespace std;
#include <wbemidl.h>
# pragma comment(lib, "wbemuuid.lib")
int _tmain(int argc, _TCHAR* argv[])
{
// Get the local locator object
IWbemServices* pNameSpace = NULL;
IWbemLocator* pWbemLocator = NULL;
CIMTYPE variant;
CoInitialize(NULL);
CoCreateInstance( CLSID_WbemLocator, NULL,
CLSCTX_INPROC_SERVER, IID_IWbemLocator, (void**) &pWbemLocator
);
// Connect to the desired namespace
BSTR bstrNameSpace = SysAllocString( L"root\\cimv2" );
HRESULT hr = WBEM_S_NO_ERROR;
hr = pWbemLocator->ConnectServer(
bstrNameSpace, // Namespace name
NULL, // User name
NULL, // Password
NULL, // Locale
0L, // Security flags
NULL, // Authority
NULL, // Wbem context
&pNameSpace // Namespace
);
if ( SUCCEEDED( hr ) )
{
// Set namespace security.
IUnknown* pUnk = NULL;
pNameSpace->QueryInterface( IID_IUnknown, (void**) &pUnk );
hr = CoSetProxyBlanket(
pNameSpace,
RPC_C_AUTHN_WINNT,
RPC_C_AUTHZ_NONE,
NULL,
RPC_C_AUTHN_LEVEL_DEFAULT,
RPC_C_IMP_LEVEL_IMPERSONATE,
NULL,
EOAC_NONE
);
if (FAILED(hr))
{
cout << "Cannot set proxy blanket. Error code: 0x"
<< hex << hr << endl;
pNameSpace->Release();
return hr;
}
hr = CoSetProxyBlanket(pUnk,
RPC_C_AUTHN_WINNT,
RPC_C_AUTHZ_NONE,
NULL,
RPC_C_AUTHN_LEVEL_DEFAULT,
RPC_C_IMP_LEVEL_IMPERSONATE,
NULL,
EOAC_NONE
);
if (FAILED(hr))
{
cout << "Cannot set proxy blanket. Error code: 0x"
<< hex << hr << endl;
pUnk->Release();
return hr;
}
// Clean up the IUnknown.
pUnk->Release();
IWbemRefresher* pRefresher = NULL;
IWbemConfigureRefresher* pConfig = NULL;
// Create a WMI Refresher and get a pointer to the
// IWbemConfigureRefresher interface.
CoCreateInstance(CLSID_WbemRefresher,
NULL,
CLSCTX_INPROC_SERVER,
IID_IWbemRefresher,
(void**) &pRefresher
);
pRefresher->QueryInterface(IID_IWbemConfigureRefresher,
(void**) &pConfig );
IWbemClassObject* pObj = NULL;
//PS:> get-wmiobject -namespace "root\cimv2" -computer "." -query "select * from Win32_PerfRawData_MSSQLSQL2005_MSSQLSQL2005GeneralStatistics"
// foreach($ctr in $( get-wmiobject -list | where {$_.Name -like '*MSSQLSQL*'})) { $ctr.Name; }
//
// To find the WMI definition use Wbemtest.exe
// Win32_PerfRawData_MSSQLSQL2005_MSSQLSQL2005GeneralStatistics is WMI Def: Win32_PerfRawData_MSSQLSQL2005_MSSQLSQL2005GeneralStatistics=@
// Add the instance to be refreshed.
hr = pConfig->AddObjectByPath(
pNameSpace,
L"Win32_PerfRawData_MSSQLSQL2005WOW_MSSQLSQL2005WOWBufferManager=@",
//L"Win32_PerfRawData_MSSQLSQL2005_MSSQLSQL2005BufferManager=@",
//L"Win32_PerfRawData_MSSQLSQL2005_MSSQLSQL2005GeneralStatistics=@",
//L"Win32_PerfRawData_PerfProc_Process.Name=\"WMIPerf\"",
0L,
NULL,
&pObj,
NULL
);
if (FAILED(hr))
{
// https://support.microsoft.com/kb/295821
// WBEM_E_INVALID_OBJECT_PATH 0x8004103A
cout << "Cannot add object. Error code: 0x"
<< hex << hr << endl;
pNameSpace->Release();
return hr;
}
// For quick property retrieval, use IWbemObjectAccess.
IWbemObjectAccess* pAcc = NULL;
pObj->QueryInterface(IID_IWbemObjectAccess,
(void**) &pAcc );
// This is not required.
pObj->Release();
// Get a property handle for the VirtualBytes property.
long lVirtualBytesHandle = 0;
//DWORD dwVirtualBytes = 0;
unsigned __int64 i64TargetPages;
hr = pAcc->GetPropertyHandle(L"Targetpages",
//L"ActiveTempTables",
&variant,
&lVirtualBytesHandle );
if (FAILED(hr))
{
cout << "Cannot GetPropertyHandle. Error code: 0x"
<< hex << hr << endl;
return hr;
}
// Refresh the object ten times and retrieve the value.
for( int x = 0; x < 10; x++ )
{
pRefresher->Refresh( 0L );
hr = pAcc->ReadQWORD( lVirtualBytesHandle, &i64TargetPages );
printf( "Target pages: %I64u\n", i64TargetPages );
//pAcc->ReadDWORD( lVirtualBytesHandle, &dwVirtualBytes );
//printf( "Process is using %lu bytes\n", dwVirtualBytes );
// Sleep for a second.
Sleep( 1000 );
}
// Clean up all the objects.
pAcc->Release();
// Done with these too.
pConfig->Release();
pRefresher->Release();
pNameSpace->Release();
}
SysFreeString( bstrNameSpace );
pWbemLocator->Release();
}
Bob Dorr - Principal SQL Server Escalation Engineer