New and Improved Collected Data Page
Collected Data
The Collected Data page is where you get a deep, technical view of the underlying data that was collected and submitted from your environment. This view complements the Issues & Risks page.
A new and improved version of the Collected Data page is now available to all RAP as a Service subscribers. This blog post covers the major changes and improvements.

Navigating to the Collected Data page
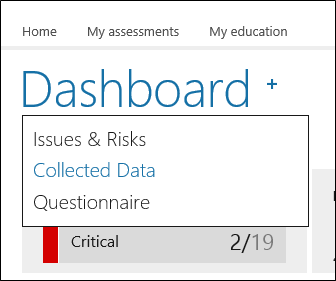
Use the quick menu from any of the assessment-specific pages to jump to the Collected Data page.
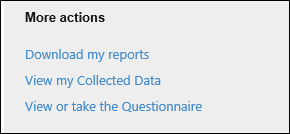
You can also use the "View my Collected Data" link under the "More actions" area of the Assessment Dashboard.
Select the data to view
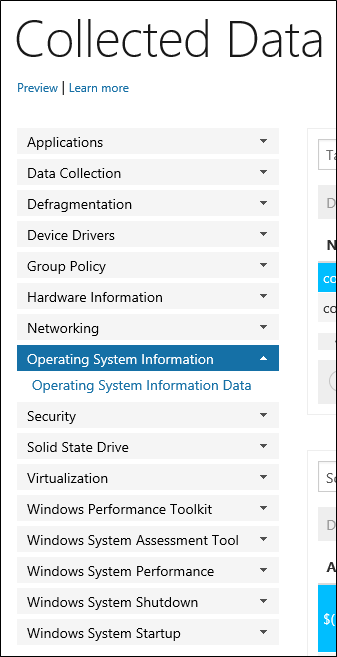
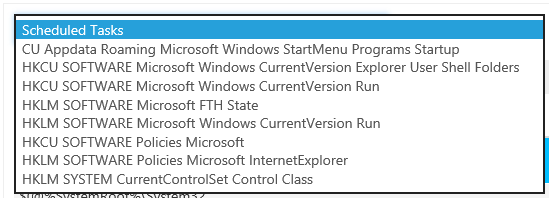
Your data is organized into sections and views within this left tree-view. Expand each section to see the available views. Click on a view to see its data.
View the data
Each view displays its data in one or more grids.
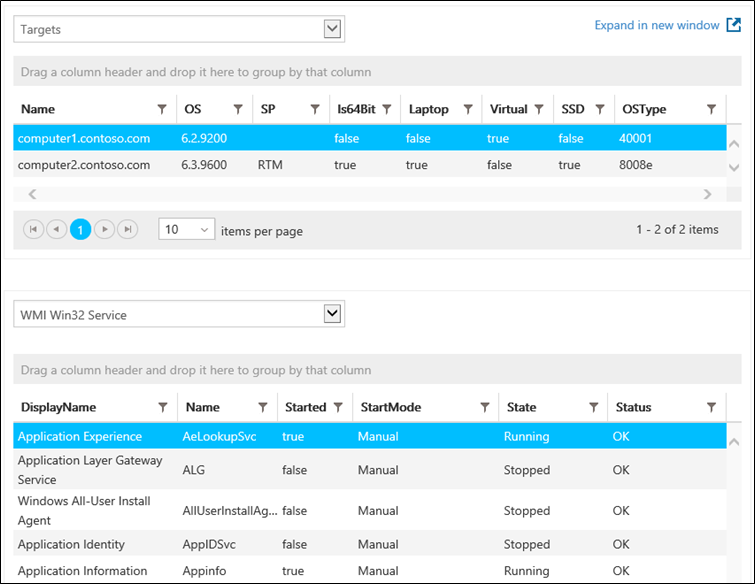
- Certain views split data between a top and bottom grid. Select items in the top to view details in the bottom.
- You can sort, filter, group and resize columns to refine your view.
- You can increase the number of rows to display per page if you need to see more at once.
Additional data
Use the drop down menu in the grid to switch between alternate views (where available).
Expand your view
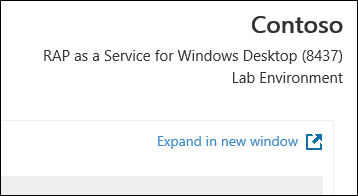
The Expand in new window option, available at the top right corner of your data, opens your data in a new window that is fully-resizable. Not only do we expand the view to whatever your screen supports we minimize or hide certain elements to give you the maximum screen space possible. You can open multiple tabs/windows if you want to jump between different views of data.
Conclusion
This new and improved Collected Data page is available today. Please sign into the website and check it out. And, as always, if it's been a while since you last submitted new data, please download and run the latest Collector and content.