Visual Studio 2012 Profiler on Windows 8.1
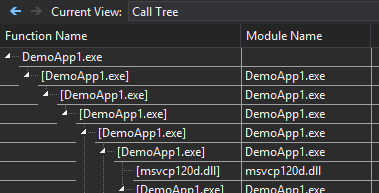
If you've used sampling to profile your application on Windows 8.1 with any version of Visual Studio 2012 other than Update 4, you may have run into an issue where symbols are not resolved for some code even if you have the correct PDB files available on your symbol path. You can tell if this is the case because the profiling report will show module names in square brackets where you would expect to see function names, as in the image below. Note that all the functions in DemoApp1.exe, which is an app I built and have symbols for, are unresolved and appear the same way as functions in msvcp120d.dll (part of the runtime, which I don't have symbols for).
This behavior is the result of changes that occurred in Windows 8.1 to the underlying system in Windows that the profiler uses to identify binaries during a profiling session. Because of this, in versions of Visual Studio before 2012 Update 4, the profiler is unable to store information in reports that makes it possible to determine where the matching symbol information (PDB) is for each binary, and whether any given PDB matches a binary that was present at collection time. Visual Studio 2012 Update 4 (and any newer version of Visual Studio) includes modifications to the profiler which make it compatible with the changes in Windows 8.1. Once you update Visual Studio, the profiler will once again be able to locate and read PDB files to resolve symbols in your profiling data.
