The Visual Studio Profiler on Windows 8
Windows 8 brought a lot of great changes to Windows including a stronger security model and new capabilities for performance tools. I am excited about how the new capabilities allow us to deliver new performance tooling not previously possible, e.g. the JavaScript Memory Analyzer for Windows Store apps. However because of the stronger security model there was also some impact to the existing profiling tools on Windows 8. In this post I will discuss the change to Windows that required us to redesign the way the Visual Studio Profiler works and the resulting impact to profiling features on Windows 8.
Note: The changes discussed in this post are only applicable when running Visual Studio on Windows 8, there are no changes to functionality on Windows 7.
Background
In order to understand why profiling functionality is different on Windows 8, I need to start with a brief overview of the profiler’s implementation. Once you understand how the profiler was implemented in Visual Studio 2010, the behavior differences on Windows 8 should make more sense.
All versions of Visual Studio through 2010 rely on a kernel mode driver to collect data. The driver was originally developed for CPU sampling so it can register for a callback based on CPU clock cycles (the default is 10 million cycles) in order to sample at a regular interval. Data collection for .NET Memory Allocation, and Concurrency profiling were then also integrated into the driver. Instrumentation profiling is a bit different because it does not rely on the driver for the instrumentation data, but it does use the driver to calculate application time (you’ll see why this is relevant below).
The changes
The profiling driver was registering for the callback in a way that interfered with a Windows kernel operation; and Windows 8 added a security feature that detects when non-operating system code modifies kernel memory (the callback was registered by changing kernel memory). When this condition is detected, Windows does a bug check that results in a blue screen since the operating system can no longer trust the integrity of the kernel. However the supported way to register for the CPU cycle callback does not allow the callback handler to inspect information about user processes due to security concerns.
Since the driver was now at odds with the enhanced security model we needed to move away from the driver to the new capabilities of Windows added since the driver was first created for Visual Studio 2005.
Impact on Visual Studio 2010 and prior versions
Unfortunately, given the need to rewrite the collection and analysis components we were not able to release an update to Visual Studio 2010 to fix the issue. Since customers don’t want to blue screen their operating system, Windows 8 added logic to prevent all incompatible versions of the profiling driver from starting (2010, 2008, and 2005).
This means that when you try to start profiling with an incompatible version you will receive the message “Error VSP1398: The monitor was unable to start the VS performance driver. Access is denied. Consider using the /Admin:Driver,Start and /Admin:Security options of VSPerfCmd from an elevated environment. ”
Which will result in the following behavior when running Visual Studio 2010 (or earlier) on Windows 8.
- CPU Sampling, .NET Memory Allocation, and Concurrency profiling will fail to start on Windows 8. The only workaround on Windows 8 is to use Visual Studio 2012 Professional or higher, or to profile on Windows 7.
- Instrumentation profiling can be launched, but the application and elapsed times will be exactly the same (this should have little impact on your ability to analyze the report, just note the elapsed time on the title bar of the summary page may not match the length of your profiling trace).
Impact on Visual Studio 2012
In Visual Studio 2012, we had to stop using the now incompatible driver for CPU sampling and instead use ETW (Event Tracing for Windows). However the move to ETW required a complete rewrite of the collection and analysis components for sampling, which unfortunately due to resource constraints meant we did not have time to add all of the existing sampling functionality to the new implementation. This has the following impact when profiling on Windows 8:
- Tier Interaction Profiling (TIP) data cannot be collected in conjunction with CPU sampling data (this continues to work with instrumentation profiling, and on Windows 7).
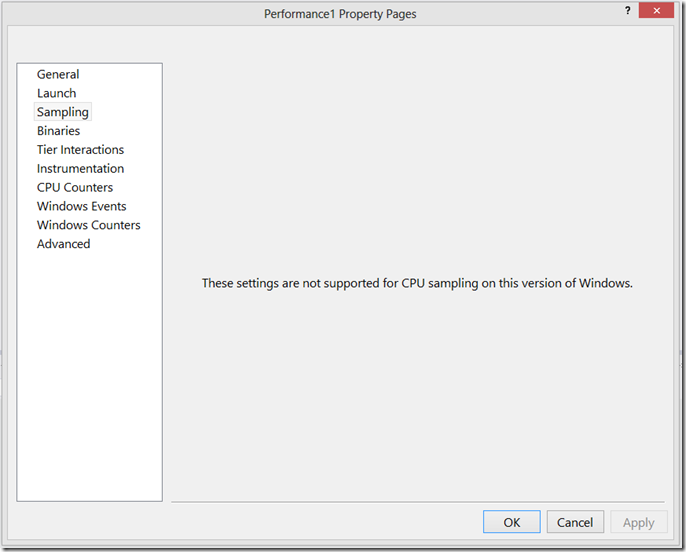
- The “Sampling” performance session properties cannot be configured, instead you will see the message “These settings are not supported for CPU sampling on this version of Windows” on the property page. It is important to note that CPU sampling works as expected with the default settings, it just does not allow for changing the advanced settings. The workaround to be able to use the advanced settings is to profile on Windows 7.
- Windows performance counters cannot be collected while CPU sampling. The workaround is to use Windows 7 if you need to collect this information while sampling.

- CPU samples for all functions executing inside NGEN’d modules will appear in the report as [NI module name], instead of the actual function name showing due to the way ETW reports the data (to resolve this see my blog post on Creating NGEN PDBs for Profiling Reports).
- vsperfcmd.exe cannot be used to collect CPU sampling data from the command line and will fail with either the error code “VSP1535” or “VSP1336” and the message “To collect sampling data on this version of Windows, use vsperf.exe”). The correct way to collect CPU sampling data from the command line is to use vsperf.exe instead.
Hope this information is useful to some of you and please let me know if you have any questions.
