How to profile ASP.NET and Silverlight at the same time
In Visual Studio 2010 SP1 we enabled the ability to profile Silverlight applications from the Visual Studio UI. Unfortunately there is a limitation where we cannot automatically attach to multiple processes on launch from inside Visual Studio, so you are still unable to profile ASP.NET and Silverlight at the same time without manually attaching to Internet Explorer after launch. Fortunately, this is relatively simple.
To profile both Silverlight and ASP.NET at the same time:
Launch your CPU sampling session against your ASP.NET application from Visual Studio
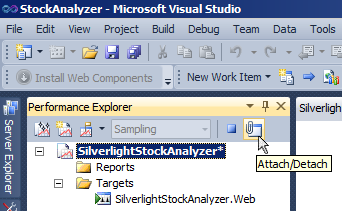
In the Performance Explorer window click “Attach/Detach”
Select the Internet Explorer process that is running your Silverlight application—if you only have one instance of Internet Explorer open with a single tab, the process will be the “iexplore” process without a Window Title.

- If you have multiple instances of Internet Explorer open, or multiple tabs inside internet explorer, you can either:
- Try looking at the CPU consumption of your iexplore.exe processes in Task Manager to see which one is most active
- Use Process Explorer
Find –> “Find Handle or DLL…” (ctrl + F)
Search for “coreclr.dll”
The “iexplore.exe” process with this dll loaded is the PID you want to attach to

- If you have multiple instances of Internet Explorer open, or multiple tabs inside internet explorer, you can either:
You are now profiling ASP.NET and Silverlight at the same time


