
Remote debugging Azure App Services
This post is provided by App Dev Managers Chris Westbrook and Susan Leighton who walk us through remote debugging a web application deployed as an Azure App Service.
In this post, we’re going to look at debugging web apps deployed to an Azure App Service. Customers are sometimes apprehensive about using cloud PaaS services, based upon their prior experience working with on-premises IIS or IIS in IaaS. They are concerned about losing control and visibility or insight into the running of their site and feel this may lead to their inability to properly support the web site. They worry they will have to revert to embedding log statements throughout their code as they did before they had easy, integrated debugging functionality.
The good news is that it is quite easy to attach your Visual Studio debugger to your site running in Azure App Service and to set breakpoints, use Quick Watch, etc., just as if you were running the site on your own local developer machine, though, maybe a bit slower.
It is important though that you don’t do this in production as all traffic to your site will be affected by your debugger. If you insert a breakpoint, any traffic to your site that hits that line of code will stop on your breakpoint and wait for you to continue. If you do this on a live production site, you can negatively impact the experience of your users. Therefore, this is best done only on development and test sites.
Here are the steps to follow to debug your web site running in Azure App Service:
For those of you who might not have a web site deployed, check out these links for a tutorial to get a sample deployed to Azure
ASP.NET Core version: https://docs.microsoft.com/en-us/azure/app-service/app-service-web-get-started-dotnet
ASP.NET Framework version: https://docs.microsoft.com/en-us/azure/app-service/app-service-web-get-started-dotnet-framework
- Make sure that your target site is running a debug version of your code.
- In Visual Studio, open the Cloud Explorer window. You can find it under the View menu, if it isn’t already one of the panels you have open. If you don’t already have this installed you can download the correct one for your version of Visual Studio from https://marketplace.visualstudio.com/publishers/MicrosoftCloudExplorer. You’ll need at least Visual Studio 2013.
- A list of your Azure subscriptions should be displayed. If not, or if the subscription you need isn’t displayed, click the Account Management icon (
 ) to add in or refresh the credentials you use to manage the Azure subscription.
 - Make sure your project is currently open and the code you have open matches what is deployed to Azure. (This will be the case if you just followed the tutorials above.) If deployments happen in your CI/CD toolset, you may need to verify the version that was deployed and do a get latest as of that version.
- Expand the subscription that houses your site. You should see a list of the types of items you have deployed in Azure. As you deploy more types of items, the list will grow.
- Expand the App Services node. This will show a list of the App Services running in your subscription. In this case we’re working with Web Apps, and you should see your web app in the list.
- Expand the node that represents the App Service/Web App that is running your site. This will show the next level of browsing hierarchy, letting you explore various items, like Deployment Slots, the actual files deployed, a list of available log files, and any web jobs you have deployed.
- Right click the name of your App Service/Web App and select “Attach Debugger”. You should see a series of dialog windows showing the progress. Depending on the nature of your internet connection this could take a while. Below are some of the messages you might see:


- If you don’t already have breakpoints set, now is a good time to add them. If you used one of the starter templates above, then you could set a breakpoint as shown here. In your Solution Explorer window, open the Controllers folder, and Open HomeController.cs (double click). Find the About() function and the line that sets the ViewBag.Message property. Then either click in the left-hand gutter (where you see the red dot below) or right click the line and select Breakpoint -> Insert Breakpoint. It should look like this:

- At this point the debugger is attached and your breakpoint is inserted, so you can test the site and check that it hits your breakpoint. When you attached the debugger it also opened a browser to your site. Switch to your browser and click on the About menu item. (If you don’t have that browser window you can always open a new one and browse to your site.) Here is what you will see when the code hits your breakpoint:

- You can now also use all your normal debugging tools, like the Locals window, Quick Watch, the Immediate window, etc.
- When done, stop debugging by clicking the red stop button in your menu bar. Although this was a small example, you can see the simple steps required to set up basic debugging using the same process that you would use to debug your on-premise apps, without reverting to embedding log statements throughout your code. Finally, I want to cover some of the things you might run into or that might be different based on cloud remote debugging vs. local debugging.
- You may at times get a window like below indicating the operation is taking a long time. I typically get this if I am debugging across my phone hotspot or on a highly shared Wi-Fi. Most likely you just need to be patient and wait for it to go away.

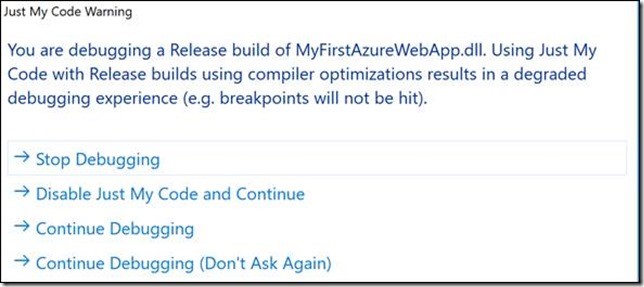
- If you didn’t deploy a debug version of your site, you will get a message like below. In this case you need to revisit the publish profile and/or the settings used in your CI/CD system to deploy a debug build. Click Close and then Stop Debugging on the next window and then redeploy a debug build and start over at the Attach Debugger step.
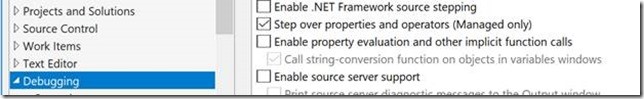
- If you find the debug experience to be slow, you may want to adjust a setting related to automatic evaluation of properties. Go to Tools menu and select Options. In the left hand menu, click on Debugging. Uncheck the “Enable property evaluation and other implicit function call” option. This will mean that the Locals, Watch, and Quick Watch windows won’t automatically retrieve and display the values of the objects you are investigating. You will see a red X error message along with the text “Implicit function evaluation is turned off by the user”. Then you click the refresh button next to the properties you want to investigate. (See the second picture below). This will speed up your debug session in general, but requires you to refresh the particular properties you want to see.

- Another difference you may encounter is related to browser timeout. When you are debugging locally the browser will wait patiently while you debug your site. When debugging remotely the browser won’t wait as long and timeout.


Premier Support for Developers provides strategic technology guidance, critical support coverage, and a range of essential services to help teams optimize development lifecycles and improve software quality. Contact your Application Development Manager (ADM) or email us to learn more about what we can do for you.
 Light
Light Dark
Dark
3 comments
My web app code is deployed in debug mode. But when I tried to attach debugger as mentioned here, I am getting this error :
System.Runtime.InteropServices.COMException (0x89710023): Unable to connect to the Microsoft Visual Studio Remote Debugger named ‘msgraphbotauth.azurewebsites.net’. The Visual Studio 2017 Remote Debugger (MSVSMON.EXE) does not appear to be running on the remote computer. This may be because a firewall is preventing communication to the remote computer. Please see Help for assistance on configuring remote debugging.at Microsoft.VisualStudio.Debugger.Interop.Internal.IDebuggerInternal120.ConnectToServer(String szServerName, VsDebugRemoteConnectOptions[] pConnectOptions, CONNECT_REASON ConnectReason, Int32 fIncrementUsageCount, IDebugCoreServer3& ppServer)at Microsoft.VisualStudio.Web.Azure.MicrosoftWeb.Operations.RemoteDiagnosticsSessionBase.ConnectToServer(String site, String user, String password)
I am experiencing the same issue. Any idea on how to resolve this?
Thank you for this tutorial. I’m seeking a tutorial of similar scope except using Visual Studio Code rather than Visual Studio proper. Can you suggest a link? Thanks again.