
Debugging Windows Applications with DebugDiag Workshop
This post is provided by Senior ADM, Jason Giordano, who spotlights our DebugDiag workshop available to Premier Support customers.
 If you have ever engaged Microsoft to assist with an application hang or crash, chances are, DebugDiag was used at some point. While there are many tools out there to capture exceptions, crash dumps, and memory information of problematic apps, few are more powerful or automated than DebugDiag. Not only does it make collecting data simple, but it provides powerful analyzers that can frequently identify the root cause of a problem in seconds. It’s a great (free) tool for both developers and IT pros to both work with Microsoft more effectively and quickly solve problems on your own.
Debugging Windows Application with DebugDiag
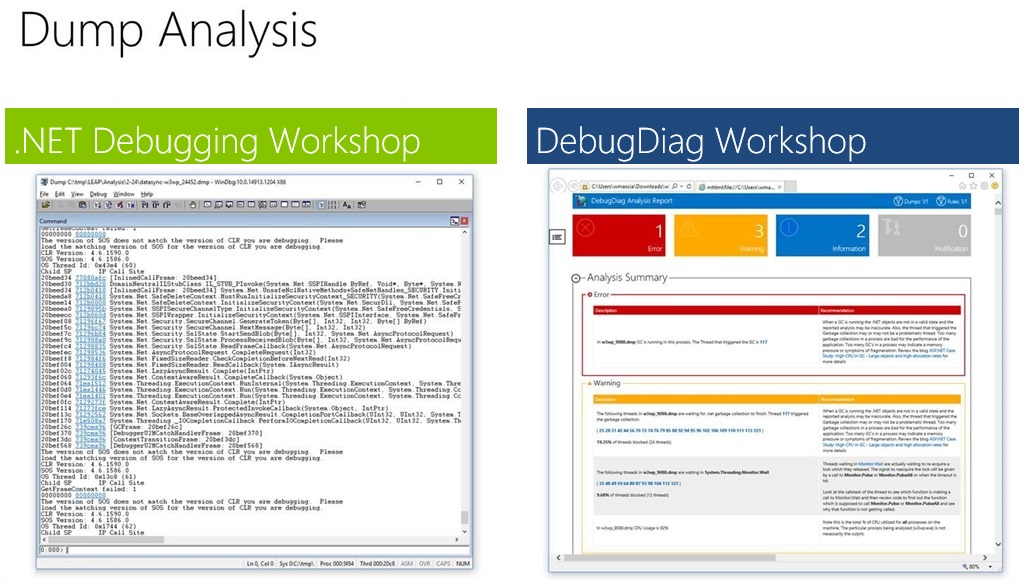
This workshop covers all the same production problem scenarios as the popular Advanced Production Level Debugging workshop – namely crashes, leaks and hangs. The data collection and analysis process is greatly simplified and accelerated by using DebugDiag instead of WinDbg, reducing the delivery time from three days to two. The depth of instruction on topics such as Windows internals and .NET garbage collection is fine-tuned to include only the essentials required to effectively troubleshoot these issues in production. This enables a wide audience of developers, IT administrators, and application support reps to all learn to troubleshoot these issues effectively without a great deal of prerequisite knowledge.

KEY FEATURES AND BENEFITS: The students will learn how to reduce the time to resolution for the major problem scenarios by focusing on these primary objectives:
- Capture the correct data at the correct time
- Generate automated analysis reports
- Interpret the reports to identify the faulty component
- Communicate to the application owner precisely what type of resolution is needed and where it should be provided.
LABS AND DEMOS: This workshop includes lectures, demos and hands-on labs. The labs make use of the same publicly-available sample application as the Advanced Production Level Debugging workshop. The sample application was written in C#, however the skills learned can be used to troubleshoot any application on the desktop or server, written in any .NET language, or in any language which supports .pdb symbol files (including native C++).
SYLLABUS:
- Module 1: Debugging And Tools: This module provides an overview of the various debugging tools typically used to troubleshoot production issues.
- Module 2: DebugDiag Overview: This module discusses all of the main concepts of DebugDiag including installation, architecture, collection and analysis.
- Module 3: Troubleshooting Exceptions: This module covers how to troubleshoot application exceptions and crashes using DebugDiag crash rules and CrashHangAnalysis.
- Module 4: Troubleshooting Hangs: This module covers how to troubleshoot application hangs, high CPU, and slow applications using DebugDiag performance rules, CrashHangAnalysis, and PerformanceAnalysis.
- Module 5: Troubleshooting Memory Leaks: This module covers how to troubleshoot memory leaks using DebugDiag leak rules, MemoryAnalysis, and DotNetMemoryAnalysis.
- Module 6: Advanced DebugDiag Topics: This module drills into more advanced DebugDiag topics, such as exporting rules, command line execution and automation APIs.
Contact your ADM to get the latest data sheet on this workshop and/or schedule a delivery with your team.
Premier Support for Developers provides strategic technology guidance, critical support coverage, and a range of essential services to help teams optimize development lifecycles and improve software quality. Contact your Application Development Manager (ADM) or email us to learn more about what we can do for you.
 Light
Light Dark
Dark
0 comments