Scenario 3 : Autoscale is not triggering for FileUploader role although CPU utilization in one of the instance FileUploader_IN_1 always stays at 100%
Referring to my blog on Azure Cloud Service Troubleshooting Series, this is the 3rd scenario of the lab. Please make sure you have followed the lab setup instructions for Compressor application as per this, to recreate the problem.
Symptom
One of the FileUploader role instance (FileUploader_IN_1) is consuming 100% CPU, whereas in the other two instances CPU utilization is normal. As per the lab instruction we have created an autoscale rule for FileUploader role based on "Percentage CPU" metric but it is not triggering for some reason. Here are the CPU utilization from all the instances:
[caption id="attachment_795" align="alignnone" width="750"]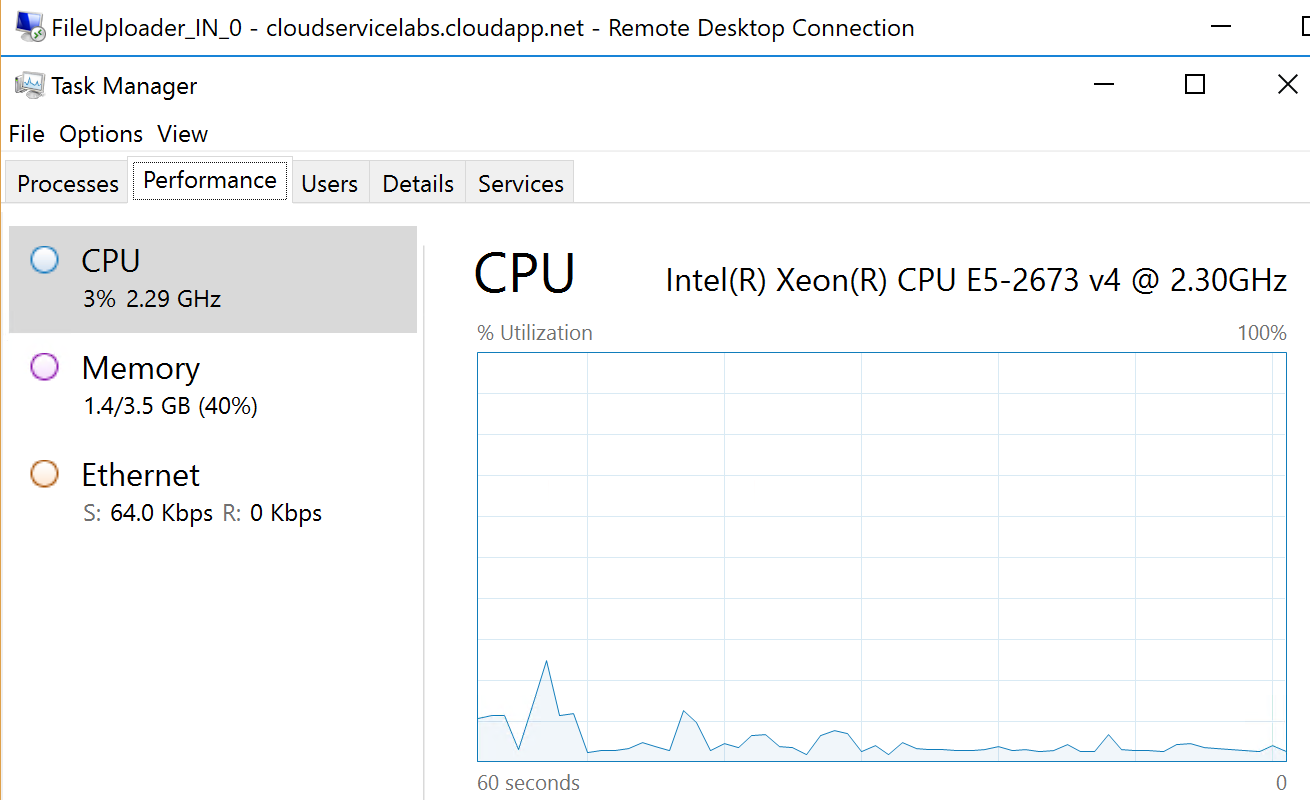 CPU utilization for FileUploader_IN_0[/caption]
[caption id="attachment_805" align="alignleft" width="750"]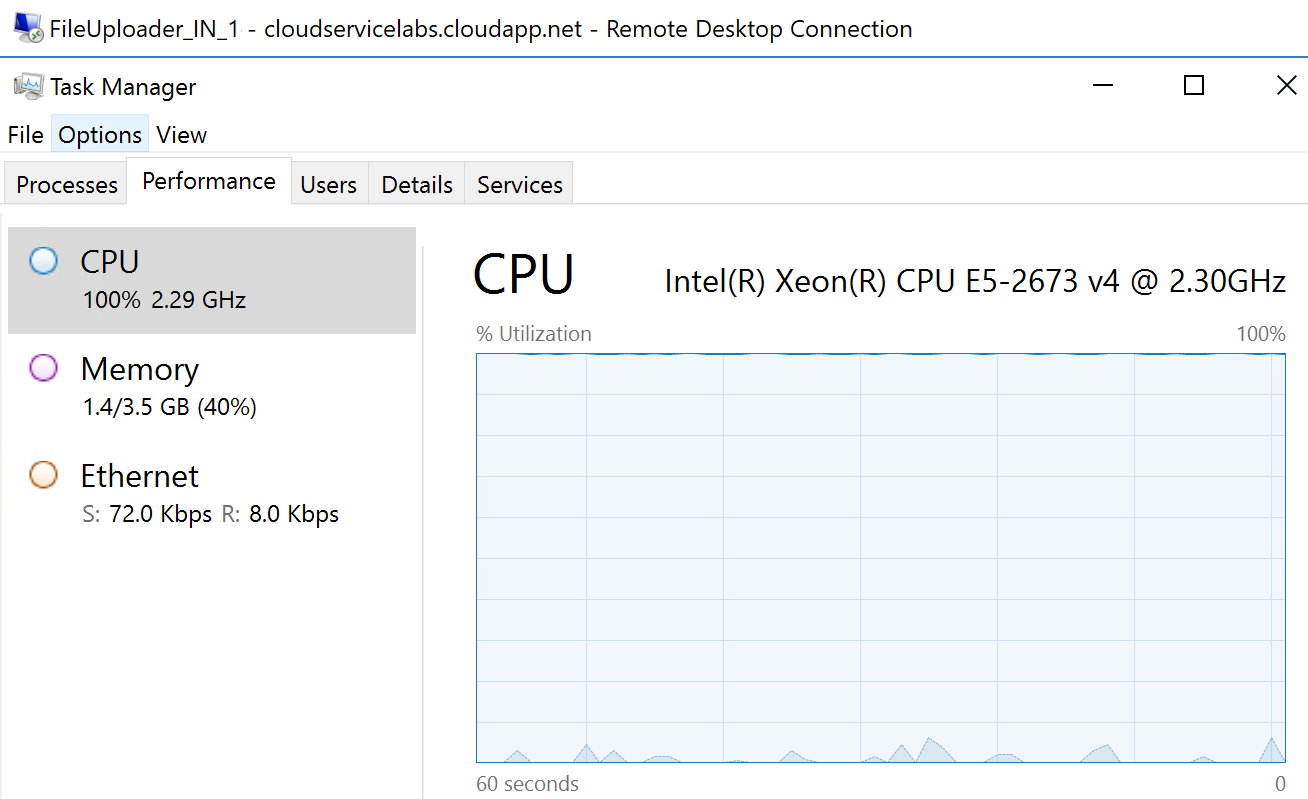 CPU utilization of FileUploader_IN_1[/caption]
[caption id="attachment_815" align="alignleft" width="751"]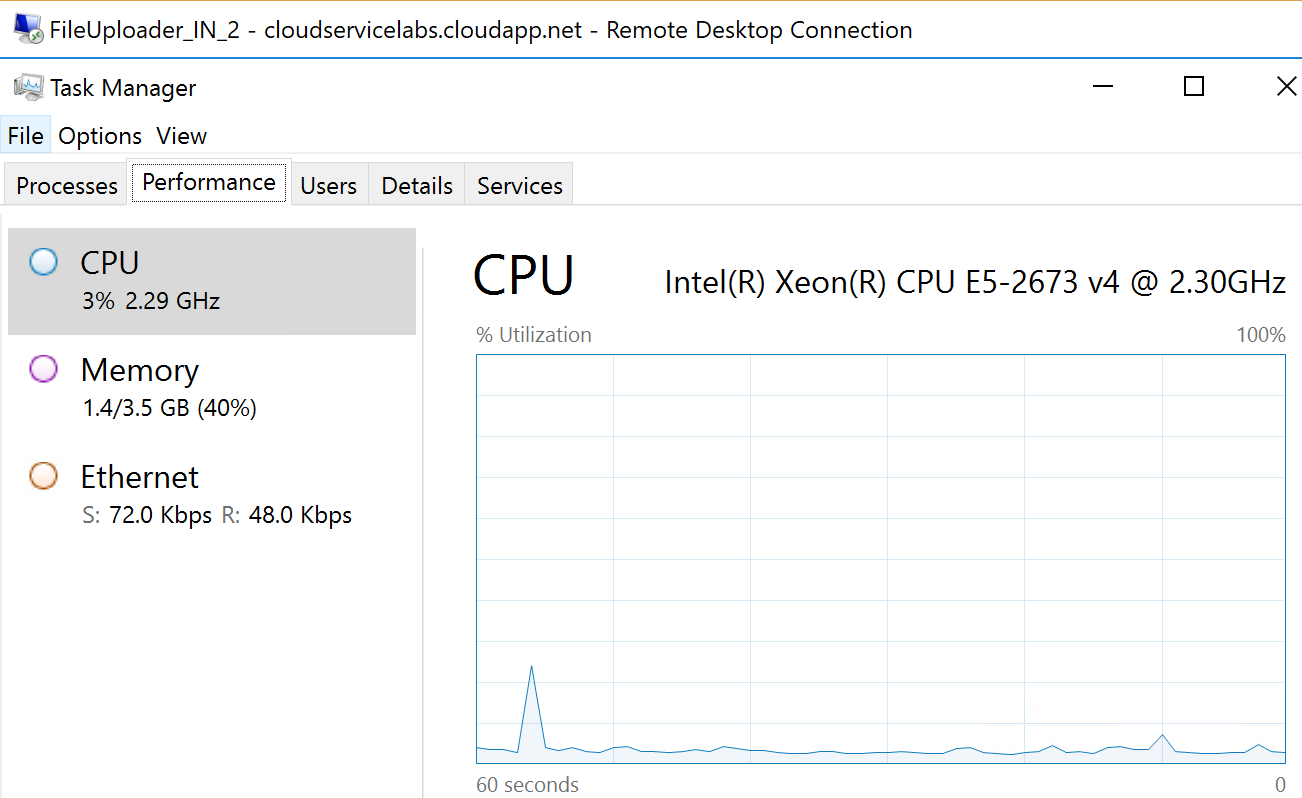 CPU utilization for FileUploader_IN_2[/caption]
Troubleshooting
If you carefully look into the autoscale rule which we have configured, it says the rule will get triggered only if the average CPU utilization of all the role instances is greater than 90, which is not happening in our case.
{
"properties": {
"name": "Autoscale based on CPU metric",
"enabled": true,
"targetResourceUri": "/subscriptions/{subscription-id}/resourceGroups/cloudservicelab/providers/Microsoft.ClassicCompute/domainNames/cloudservicelabs/slots/Production/roles/FileUploader",
"profiles": [
{
"name": "Auto created scale condition",
"capacity": {
"minimum": "1",
"maximum": "4",
"default": "1"
},
"rules": [
{
"scaleAction": {
"direction": "Increase",
"type": "ChangeCount",
"value": "1",
"cooldown": "PT10M"
},
"metricTrigger": {
"metricName": "Percentage CPU",
"metricNamespace": "",
"metricResourceUri": "/subscriptions/{subscription-id}/resourceGroups/cloudservicelab/providers/Microsoft.ClassicCompute/domainNames/cloudservicelabs/slots/Production/roles/FileUploader",
"operator": "GreaterThan" ,
"statistic": "Average" ,
"threshold": 90,
"timeAggregation": "Average",
"timeGrain": "PT5M",
"timeWindow": "PT30M"
}
}
]
}
],
"notifications": [],
"targetResourceLocation": "southcentralus"
}
}
Set up diagnostics for Azure Cloud Services and check the CPU utilization of each role instance from WADPerformanceCountersTable. You can also fetch metric data for the cloud service role using this REST API or PowerShell as well.
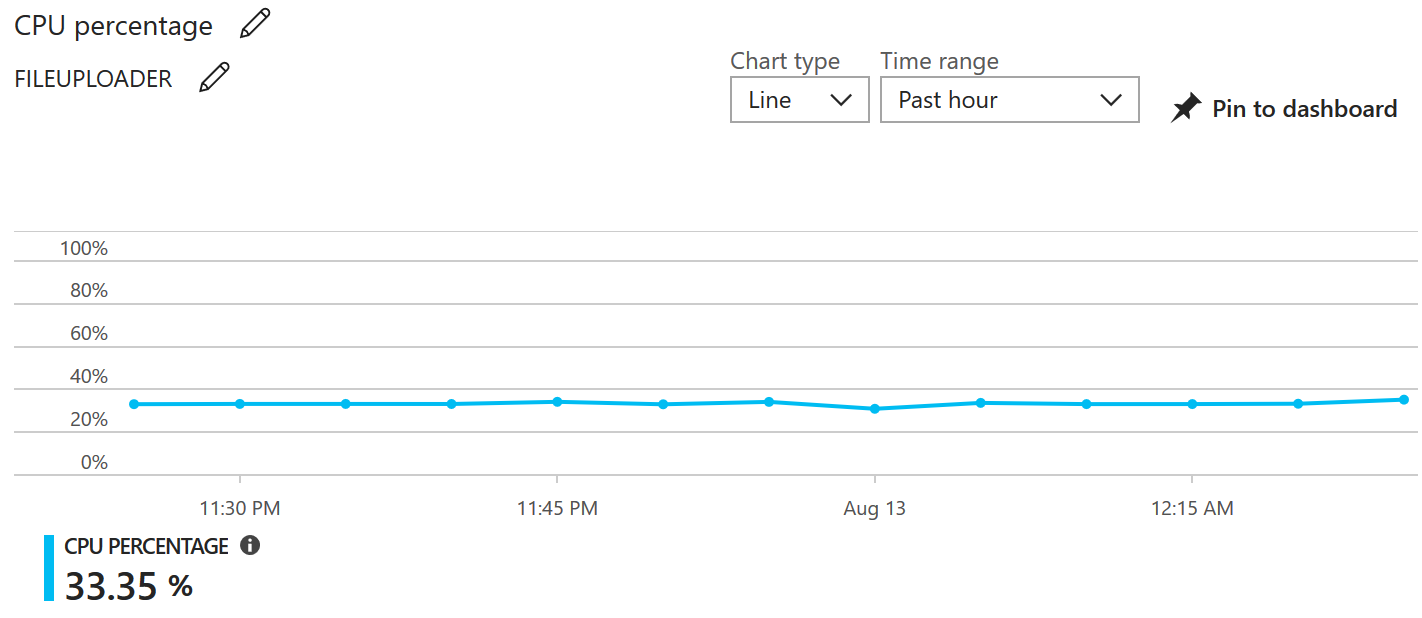
You can also monitor the average CPU utilization of FileUploader role from Metrics tab in you cloud service resource. So as you can see from the below graph the average CPU utilization is around 33.35% which is quite below the threshold.
So the bottom line is autoscaling rules that use a detection mechanism based on a measured trigger attribute (such as CPU usage) use an aggregated value over time, rather than instantaneous values, to trigger an autoscaling action. By default, the aggregate is an average of the values across all the instances of the role. So, in case of multiple instances, each PaaS VM reports a number for percentage CPU. To consolidate these, the cloud service role calculates the “statistic” across all of the instances. For instance, if there were three instances in a cloud service role, one running at 30% CPU, second one at 60% and another running at 90% CPU, the role would emit an average CPU utilization of 60%.
I hope you have got an idea how autoscaling works in Azure Cloud Service.
Happy Learning !