VS2015 Remote Debugging JavaScript – Part 2
VS2015 Remote Debugging JavaScript Hosted in Web Browser Control
Earlier we talked about how to debug JavaScript remotely from Internet Explorer process. This one does not differ at all from it. All you need to do is select different target process. If you haven't read the post, then here is the link.
https://blogs.msdn.com/b/prakashpatel/archive/2015/10/23/vs2015-remote-debugging-javascript.aspx
I'll start from the step that assumes that all the configuration is taken care of. If you run into any issues, then you may want to read the FAQ section in the previous blog.
Sample HTML Page
Here is a sample HTML page that I'm using for debugging – it is very basic. I have saved it as TestLeak.html.
<!DOCTYPE html>
<html>
<head>
<style>
body.segoe {
font-family: "Segoe UI", Verdana, serif;
}
</style>
<script type="text/javascript">
function throwError() {
document.getElementById("LeakedDiv").appendChild("<p>It worked!</p>"); // Misspelled LeakedDiv (L is upper case)
}
</script>
</head>
<body class="segoe" id="leakedDiv">
<div>
<input id="btnThrowError" type="button" value="Throw an error" onclick="throwError()" />
</div>
</body>
</html>
Sample WinForms Application Hosting Web Browser Control
Start Visual Studio
To create a sample WinForms application
- From Start Screen: Click on New Project… or
- From Menu: File à New… à New Project… or
- Keyboard Shortcut: Control + Shift + N
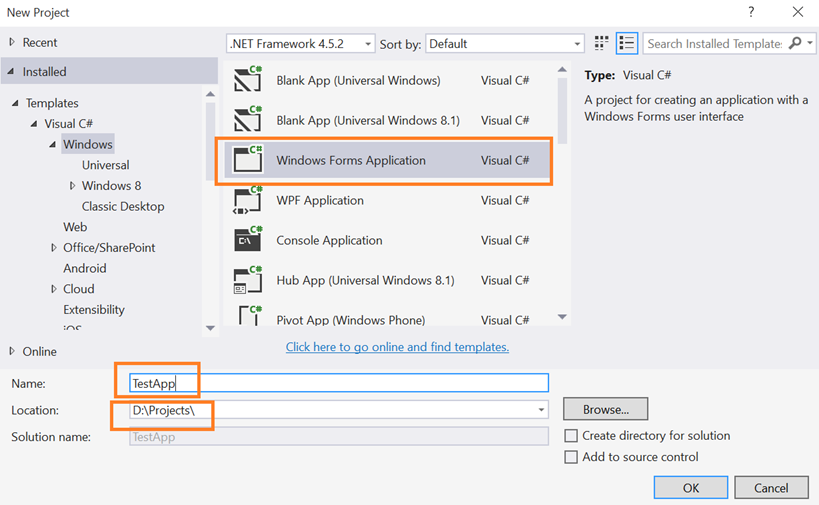
I'm choosing TestApp as name but you can choose any other name. You may specify additional configuration if desired. Click on OK to continue.
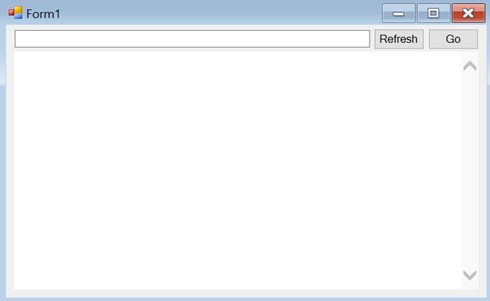
Create a simple form with 2 button, 1 textbox and a WebBrowserControl on the form as shown. Rename them as shown below. You can also drop status bar on the form if you like.
Add following line of code to the event handlers for Refresh and OK button. You can double click on the buttons to add event handlers
private void button1_Click(object sender, EventArgs e)
{
if (!String.IsNullOrWhiteSpace(textBox1.Text))
webBrowser1.Navigate(textBox1.Text);
}
private void button2_Click(object sender, EventArgs e)
{
webBrowser1.Refresh(WebBrowserRefreshOption.Completely);
}
6. Add following line of code to the event handlers for Refresh and OK button. You can double click on the buttons to add event handlers
Now compile and copy the binary (TestApp.exe) to the target machine.
Connecting VS2015 to VS2015 Remote Debugger on Target Machine
Start Sample WebBrowser application on the target machine where you just now installed VS2015 Remote Debugger.
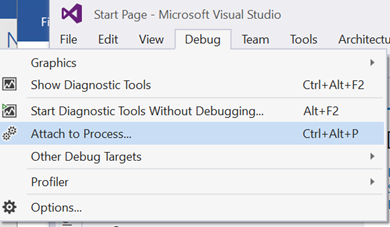
On VS2015 Machine, open VS2015. Click on Debug Attach to Process…
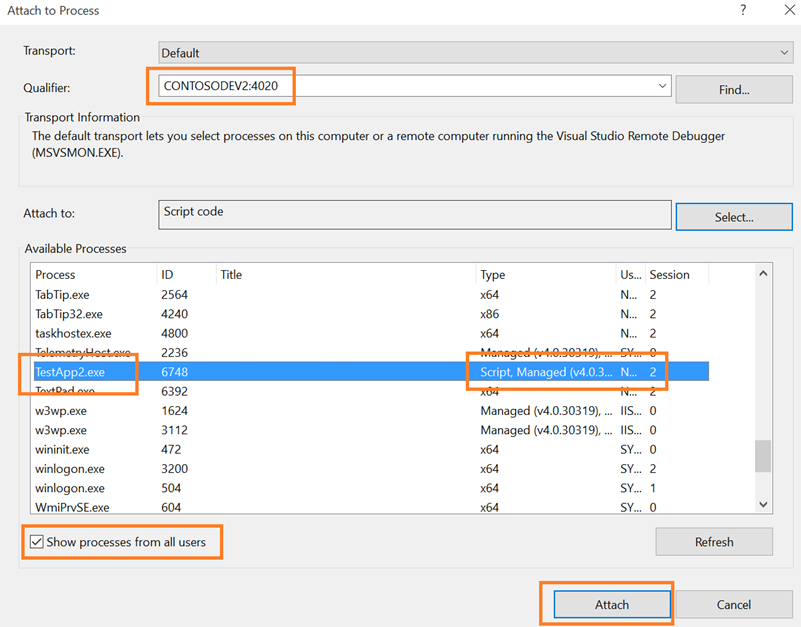
On the Attach to Process window, specify target machine name in the Qualifier textbox. Or click on Find… button to find the machine in the domain. I'm connecting to my test machine named ContosoDev2.
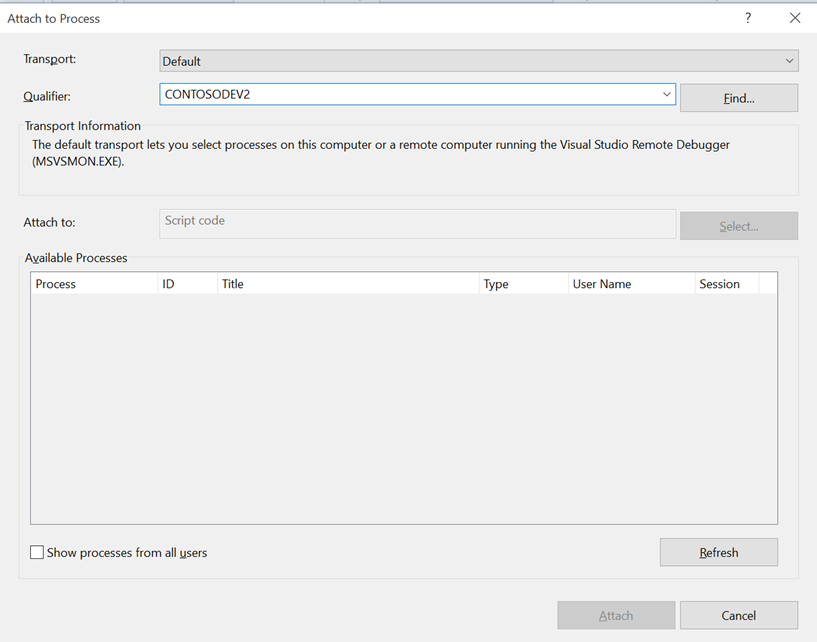
By default, the list will not be refreshed so click on Refresh button to see the list of running processes. You may want to select Show processes from all users if you need to debug process launched by another user.
Note:
- If you configured Remote Debugger to run under LocalSystem account (or accepted default settings) then, you'll have to select Show processes from all users option to view your processes. As it will only list processes running under SYSTEM account in all sessions.
- The Qualifier may change from ContosoDev2 to Contosodev2:4020.
- Make sure you select Script code as debugging option or Attach to as shown in the screenshot.
Select the target process and click on Attach button. Make sure Script is displayed next to the target process. By default Script and Managed code debugging will be selected by VS2015.
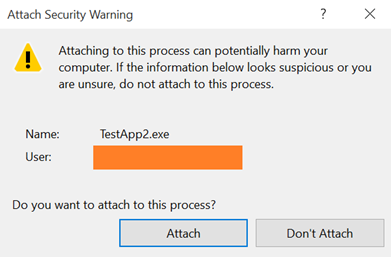
Visual Studio warns you against potential security compromise that may happen when you attach to a remote process. If you know the target process and site it has navigated to click on Attach to continue.
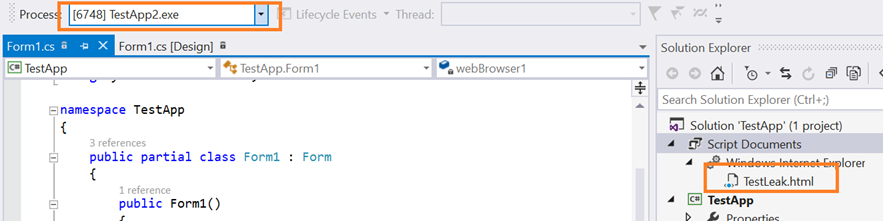
After the connection is successful, you should see TestLeak.html page in the VS2015 Solution Explorer.
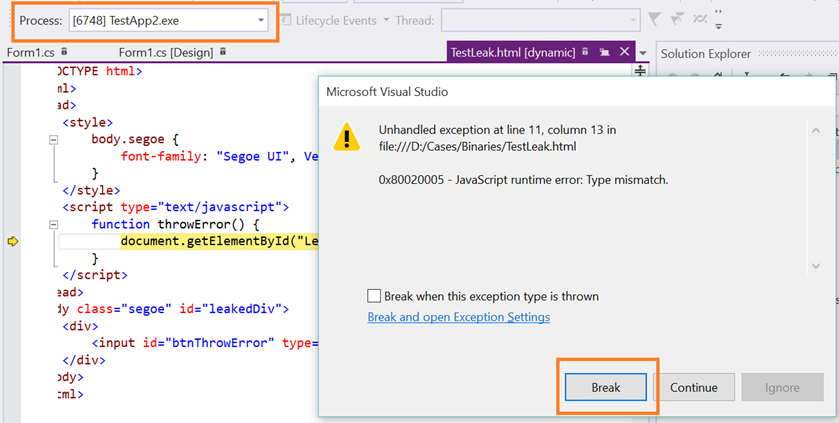
Now, click on Throw an error button.
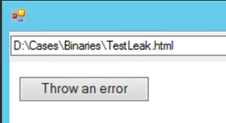
It should break in the debugger.
The goal here is to make you familiar with the tool feature. Hope you find it useful.
Sample Source Code and Project
You may want to rename TestLeak.html.txt to TestLeak.html