Test Impact Analysis in Visual Studio 2010
One of the new features you’ll find in Visual Studio 2010 (Premium and Ultimate editions) is test impact analysis. Inside of Visual Studio, this feature is used to immediately inform the developer of what tests they should run to verify the code changes they are making. You can also find the feature as part of Team Foundation Build and Microsoft Test and Lab Management, but I will limit today’s blog post to what you’ll find in Visual Studio.
I should call out the fact that this feature only supports managed code (e.g. VB.NET,C#,C++/CLI) in 2010. Native code is not yet supported, but it is something we would like to add support for in a future release.
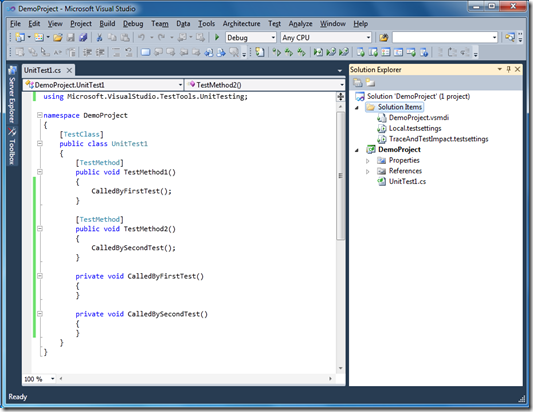
To get started, let’s create a C# unit test project called “DemoProject”. Here’s what it might look like with some additional unit test code:
As you can see, I’ve defined two tests that each call a different private method. This is obviously a very contrived example, but hopefully I’ll be able to demonstrate how this is applicable to your own source base by the end of this blog entry.
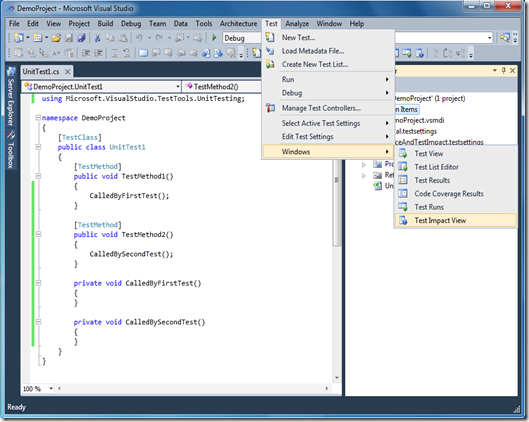
Next, let’s bring up the Test Impact View. This is a new tool window that exposes the test impact analysis feature in Visual Studio. You can show the Test Impact View by selecting the “Test –> Windows –> Test Impact View” menu item, as seen here:
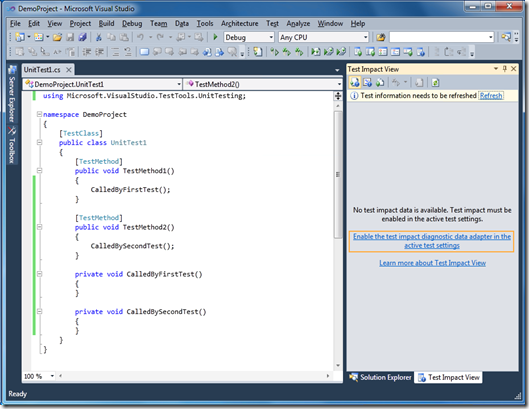
It should look something like this (note, the images here may display slightly different text than what you’ll find in Beta 2 because these are from a newer build):
I’ve highlighted an important link in the view above. This link is visible when the active test settings does not have the “test impact diagnostic data adapter” (that’s a mouthful, isn’t it?) enabled. Diagnostic data adapters allow the capturing of data while tests are executing. You’ll also find a diagnostic data adapter for IntelliTrace, code coverage, and more, in the test settings. The way the test impact diagnostic data adapter works is by dynamically instrumenting your code at runtime to record what was executed by each test. Each test that executed will produce its own “testimpact.xml” file attachment. The contents of this file are not something I’m going to discuss at this time.
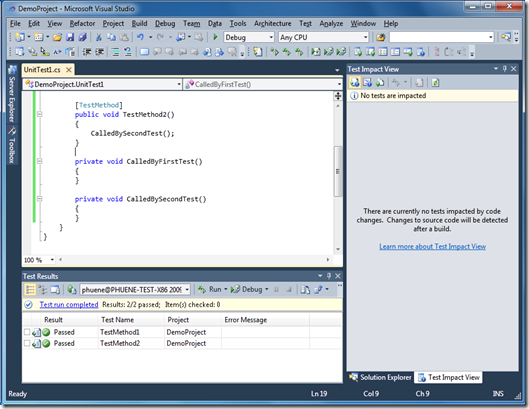
Clicking the link will enable test impact data collection when tests are run. Let’s click the link and then run all tests by selecting the “Test –> Run –> All Tests In Solution” menu item, to arrive at this:
One thing I’ll mention is that we only collect data for passing tests. If a test fails, we’ll continue to use the last set of data we successfully collected. Now comes the interesting part: making a change to the source code. Let’s insert the following line into CalledByFirstTest and then build the solution:
1: System.Console.WriteLine("Hello world");
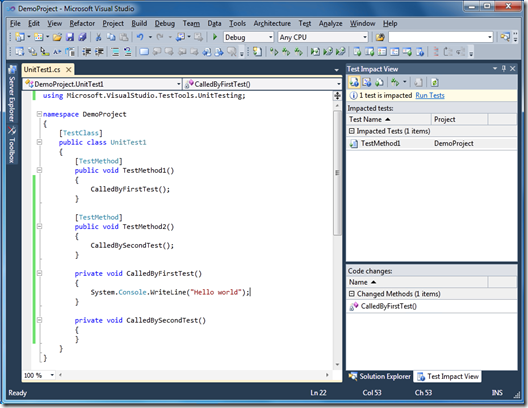
Test impact analysis will analyze, in the background, the resulting assemblies produced by the build to look for meaningful changes to method instructions or data such as strings. This means that changes to comments or changes that are optimized away by the compiler (i.e. foo + 10 => foo + 5 + 5) are ignored by test impact analysis. Since we know TestMethod1 calls the changed method CalledByFirstTest, the tool window immediately recommends that we run TestMethod1 to verify the change:
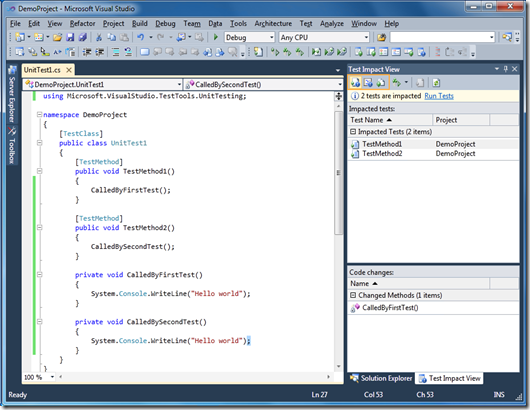
Now let’s make the same change to the other private method and build again:
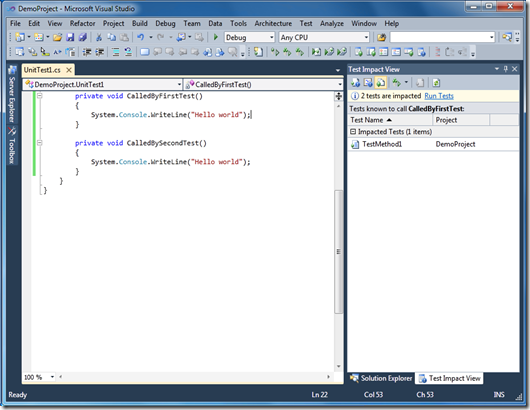
We now have two tests impacted. The selected impacted test is TestMethod1 in and the lower pane in the view is showing the code changes test impact analysis thinks is currently impacting the test. If we selected the other impacted test, we would see CalledBySecondTest in the lower pane, as expected.
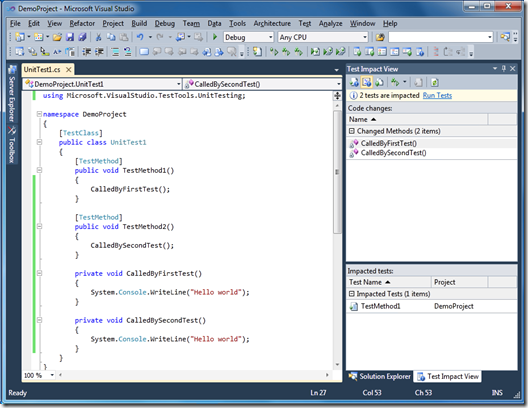
I’ve highlighted three buttons at the top of the Test Impact View in the image above. From left to right: the first button is for displaying impacted tests (this is the default view), the second is for displaying the code changes remaining to be verified, and the third tab is for showing tests known to call a method. Clicking on the second button from the left results in this:
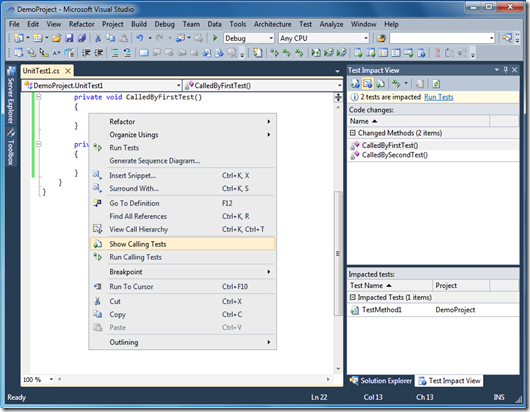
Here we see the two methods we changed. Selecting a code change shows the tests that need to run to verify it. Once all impacted tests are run successfully, the code change will no longer show up in this list until the code is changed again. To display tests known to call a particular method, right click inside of the method in the editor and select “Show Calling Tests”, like this:
Clicking this menu item will switch the test impact view into the “show calling tests” mode:
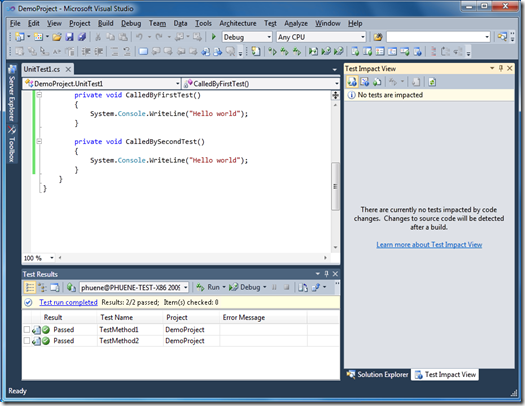
The view displays a list of tests known (i.e. have been run with test impact data collection enabled) to call the method in question. If you frequently run unit tests inside of Visual Studio, this is a good way to quickly tell if the method you’re modifying will impact tests if it is changed. Now let’s run all impacted tests by selecting “Test –> Run –> All Impacted Tests” menu item or by using the keyboard shortcut (Ctrl+R,Y). The two tests will run successfully, shown here:
As both tests have run successfully, the number of impacted tests falls to zero and there are no outstanding code changes to verify. If you change the methods again, the test impact view will display what needs to be run to verify the changes.
As I previously stated, this example is a rather silly one: we only use a single test project and the code being modified is in the test class itself. In practice, you may have a large source base of code and a large number of tests that test your code. If tests are run with test impact data collection enabled, the tests exist in the current solution context, and the code being modified also exists in a project in the current solution, then the test impact view will recommend what tests to run when you make your code changes.
I encourage you to play around with the feature beyond what is covered in this blog entry, such as with Coded UI tests (another new VS 2010 feature). I think it’s rather neat to be able to record UI tests, run them with test impact data collection enabled, make changes to methods that are traditionally hard to test via a unit test (e.g. some UI event you can’t mock up easily) and build, hit Ctrl+R,Y (run all impacted tests), and then watch your application be UI tested. Enjoy.
