"HPC+WCF Services" Performance Observations
I recently mis-spoke at a TechEd 2008 session in Orlando and afterwards received a few emails from an attentive audience requesting clarification. The specific session was INF301 "Application Development for High Performance Computing on the Windows Platform". I presented a slide that illustrated overly simplified linear scaling and confusing request-response latency figures. The specific topic was "WCF Services" hosted via Windows HPC Server 2008. See an introduction to this topic at "The HPC Show" on Channel9.
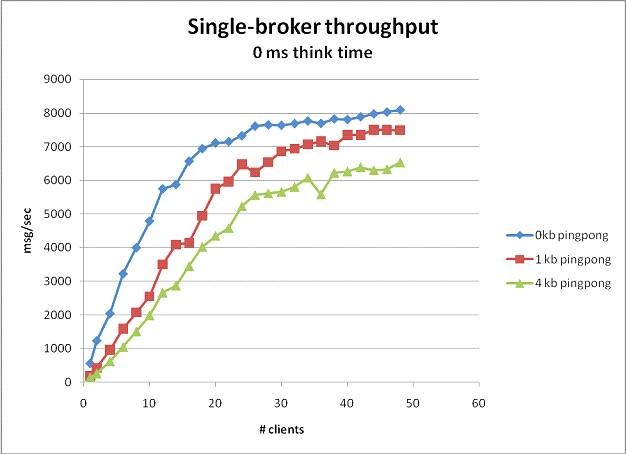
Perhaps a better way to qualify WCF service performance is in terms of message through-put (view from the broker) and client-latency (view from the client). The following graph illustrates message through-put with varying message sizes and a single broker-node (i.e. router) accomplishing load-balancing. Note the vertical axis illustrates "messages per second" and the horizontal axis illustrates the "number of client applications". In essence, with just one broker-node servicing multiple clients, the broker responds to around 8000 small messages per second before becoming a bottle-neck itself. The red and green plots illustrate response rates with corresponding larger message sizes. This plot serves to delineate capacity at the broker-node which may vary depending upon networking capacity and raw-processing capacity. A solution designer would want to consider adding another broker-node, for instance, to the cluster at this point in order to service more than 8000 small messages per second.
What if we add a 25 millisecond workload (i.e. 'thinktime') to the hosted WCF service and consider latency from the client perspective (caveat: the graphing tool subtracts the 25 millisecond workload from each data-point)? Note that the following illustration involves a larger number of clients, again hitting one broker-node and, in this test case, backed by a 160 core cluster. As the number of clients exceeds 150, we begin to saturate the 160 core cluster. Observe that the graph is no longer showing the number of messages per second, as seen at the broker-node above, but rather the overall latency as seen via the client(s). Many factors determine capacity but this demonstrates that a single broker can easily handle 150 simultaneous clients with excellent latency given a particular messages size. Capacity design considerations in this case include additional compute nodes first and then additional broker nodes as the message rate approaches that illustrated above.
![clip_image002[3]](https://msdntnarchive.blob.core.windows.net/media/TNBlogsFS/BlogFileStorage/blogs_msdn/philpenn/WindowsLiveWriter/HPCWCFServicesPerformanceObservations_EF17/clip_image002%5B3%5D.jpg)
Of course, we haven't presented every detail relative to the test cluster and network configuration but the general use-case scenario provides some bounding considerations relative to latency and through-put. Please use the contact feature of this blog if you would like to learn more or if you have specific questions.