Lesser-known Multi-threaded Debugging Support in Visual Studio 2010
We’ve been very excited about the new debugging windows in Visual Studio 2010, namely Parallel Tasks and Parallel Stacks, as well as the newly revamped Threads window, and thus we’ve talked about them quite a bit. For an overview, you can read the MSDN Magazine article at https://msdn.microsoft.com/en-us/magazine/ee410778.aspx, and Daniel Moth has a larger collection of related materials in his blog post on Parallel Debugging. From all the coverage these windows have been getting, however, it would be easy to overlook many of the other niceties that have been added to Visual Studio 2010 around multithreaded debugging, and in particular related to the new parallelism support in .NET 4. With this post, I hope to bring some of those lesser-known but still quite useful features to light.
DebuggerDisplayAttribute
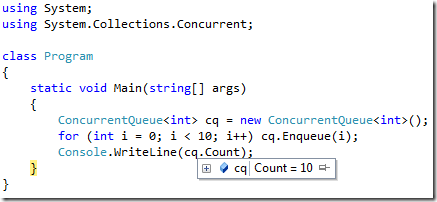
Wherever applicable, our new .NET 4 parallelism-related types sport DebuggerDisplay attributes in order to make it really easy to see important details about the relevant component at a glance . This, of course, exists for collections as you would expect, e.g.
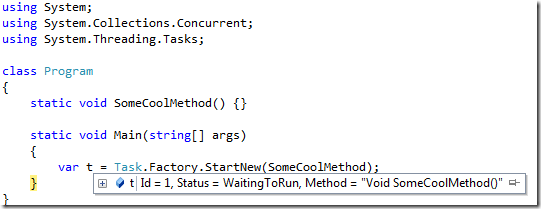
However, it also works for other types. For example, if you hover over an instance of Task, you’ll see details like the Task’s action or function, its execution status, etc.:
The following parallelism-related types new to System, System.Threading, System.Threading.Tasks, and System.Collections.Concurrent in .NET 4 all have DebuggerDisplayAttribute applied to them to showcase useful data:
- AggregateException
- Barrier
- BlockingCollection<T>
- CancellationToken
- ConcurrentBag<T>
- ConcurrentDictionary<TKey,TValue>
- ConcurrentQueue<T>
- ConcurrentStack<T>
- CountdownEvent
- Lazy<T>
- ManualResetEventSlim
- ParallelLoopState
- SemaphoreSlim
- SpinLock
- Task
- Task<TResult>
- TaskScheduler
- ThreadLocal<T>
DebuggerTypeProxyAttribute
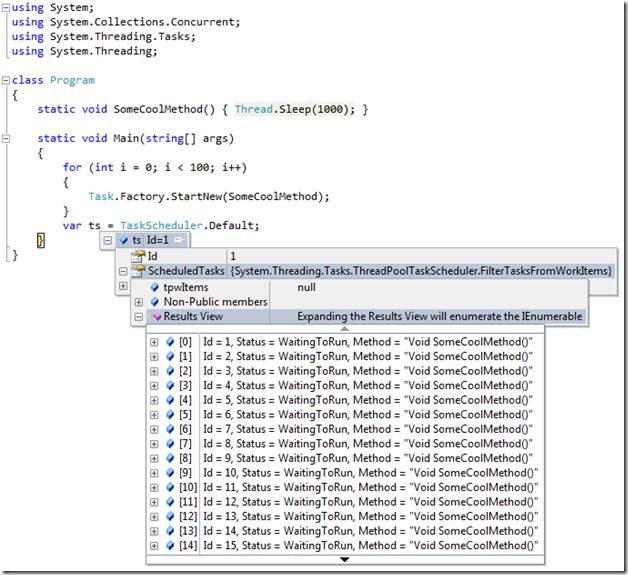
Similarly, wherever applicable, our new .NET 4 parallelism-related types utilize debugger type proxies in order to provide a concise and useful debugging view of the state of an instance. For example, the TaskScheduler type (which represents the scheduling infrastructure used to execute tasks) provides a type proxy that allows you to see all of the tasks that have been scheduled to that scheduler instance and are awaiting execution, e.g.
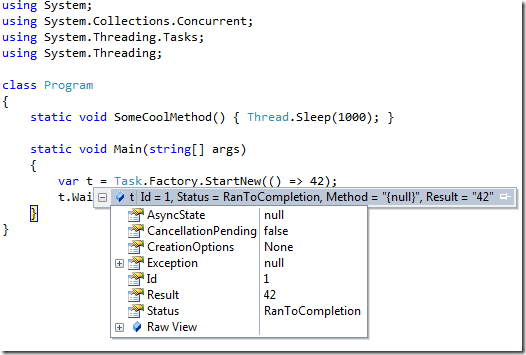
Task itself also has a debugger type proxy, so you could further expand one of these tasks to understand more details, or just view an individual task you might have a reference to, e.g.:
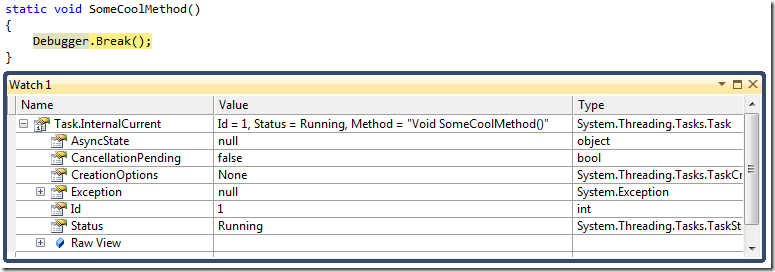
There are some cool tricks you can play with this as well. For example, the Task type internally maintains information about what the current Task is; while this information isn’t exposed publicly, and while it could change in the future, for .NET 4 you can access this information through the debugger by accessing Task’s static InternalCurrent property, allowing you to learn about the current task executing:
Here’s a list of the new parallelism-related types that have a DebuggerTypeProxy attribute applied:
- BlockingCollection<T>
- ConcurrentBag<T>
- ConcurrentDictionary<TKey,TValue>
- ConcurrentQueue<T>
- ConcurrentStack<T>
- Lazy<T>
- SpinLock
- Task
- Task<TResult>
- TaskScheduler
- ThreadLocal<T>
IntelliTrace Events
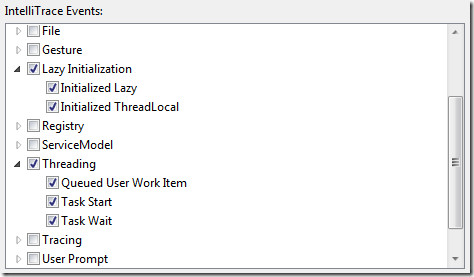
IntelliTrace is an extremely cool new feature of Visual Studio 2010, one you can learn more about in the MSDN Magazine article at http://msdn.microsoft.com/en-us/magazine/ee336126.aspx. Built-in to Visual Studio 2010 are several events specific to parallelism and/or that relate to some of these new .NET 4 types. You can see these events in the debugging options for IntelliTrace:
These events are not enabled by default, so if you want them to be tracked, you’ll need to enable them in the above options dialog, available through “Debugging | Options and Settings… | IntelliTrace | IntelliTrace Events”.
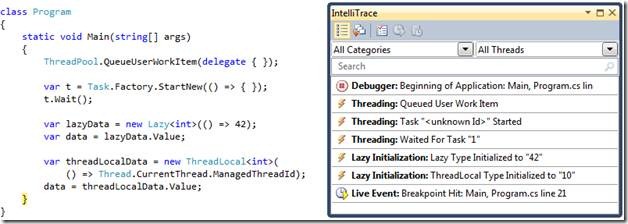
With these events selected, you’ll see the relevant events show up in the IntelliTrace events window:
Thread Slipping
When stopped at breakpoints, the debugger is able to use technology called “funcevals” to execute code in order to compute results, such as to show you data in windows like Watch and Locals, in tooltips, and so forth. Of course, this funceval is able to execute any arbitrary .NET code, including code that might take locks. When stopped at a breakpoint, the debugger has frozen all of the application’s threads, and then to run a funceval, it wakes up one thread and uses it to run the target function. If this function depends on another thread doing some work in order for the unfrozen thread to make forward progress, the system will deadlock, as the thread that needs to do the work is unable to do so.
The Visual Studio 2010 debugger introduces the concept of “thread slipping,” which the new parallelism types in .NET 4 take advantage of in key places. If the debugger is making a funceval into a particular piece of code we know is likely to result in this kind of negative situation, the Framework informs the debugger that it should stop what it’s doing and make sure the user really wants to continue. The user is then presented with an option that allows the debugger to wake up all of the processes’ threads until the target function completes, at which point the debugger will again freeze all of the threads.
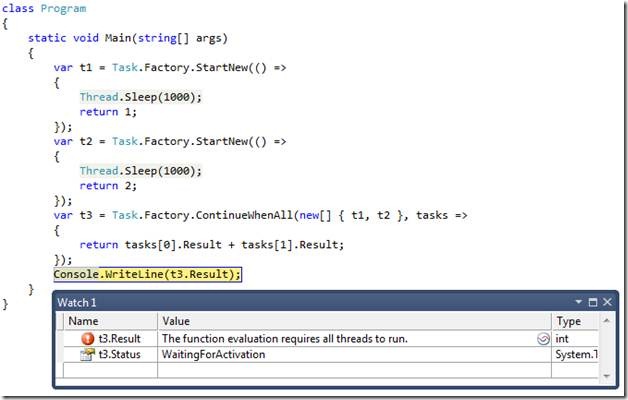
We take advantage of this, for example, in Task<T>.Result:
Notice the little threads icon in the Watch window line for t3.Result:
By clicking that button, the debugger will wake up the system until t3.Result completes (or until a really long timeout expires):
This thread slipping functionality is used in several places throughout Parallel Extensions, including Lazy<T>, ThreadLocal<T>, Task<T>, and PLINQ. You can utilize it in your own types as well, by calling System.Diagnostics.Debugger.NotifyOfCrossThreadDependency() prior to the problematic operation.



 Light
Light Dark
Dark
0 comments