Managing Server Side Analysis Services Profiler Trace
I have been asked how to run Analysis Services Profiler Trace as Server side Trace. There are few ways of running trace on server like astrace tool. In this post, I am going to show you how you can create server side trace using xmla and stop trace.
First Step is to create XMLA for your profiler trace events. Here are steps:
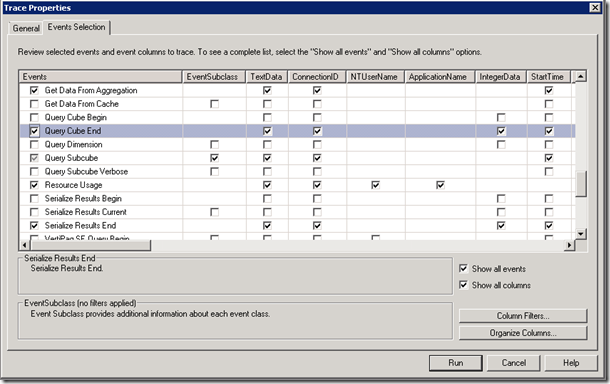
-Open SQL Server Profiler Trace
-Connect to Analysis Services Instance you would like to capture events for.
-Choose your events
-Click Run and then stop trace in case you don’t want to add any overhead of running GUI.
-Now we have events in hand we want to collect.
-Next step is to export these events as XMLA file.
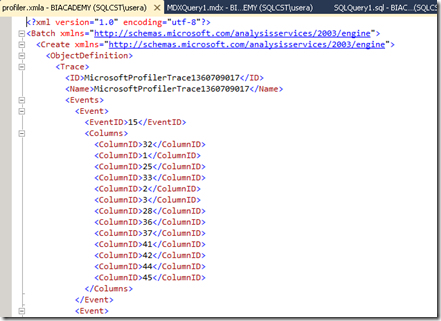
- Click File->Export->Script Trace Definition->For Analysis Services 2005-SQL11->Save as Profiler.XMLA
-Now we have generated script to create trace on server side. With few modification, you can specify rollover information. Quick note, although you choose rollover options in Profiler trace GUI, when you export Trace events as XMLA script, it doesn’t save rollover info to xmla file. You need to manually attributes.
-Let’s open XMLA in Management Studio first:
-Connect your Analysis Services instance through Management Studio.
-Click XMLA button shown below and drag and drop your xmla file into this window.
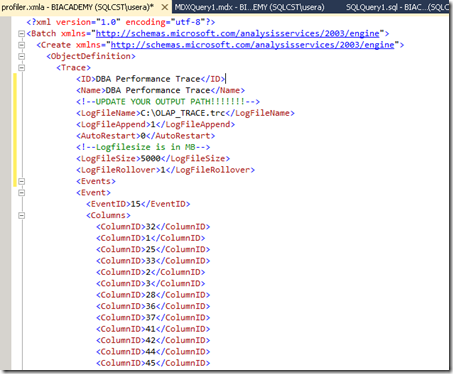
-You will see similar Trace definition like below:
Here are text version of attributes in case you may want to copy directly from this posting:
<ID>DBA Performance Trace</ID>
<Name>DBA Performance Trace</Name>
<!--UPDATE YOUR OUTPUT PATH!!!!!!!-->
<LogFileName>C:\OLAP_TRACE.trc</LogFileName>
<LogFileAppend>1</LogFileAppend>
<AutoRestart>0</AutoRestart>
<!--Logfilesize is in MB-->
<LogFileSize>5000</LogFileSize>
<LogFileRollover>1</LogFileRollover>
-You can add File location, rollover options just after Name attribute like below
-Delete following tag (first line of your script) from script as you don’t need to specify <?xml> tag in your xmla command. Delete following line from your script then execute script
-Once you execute script, Server Side trace is created. There are two ways of checking running traces:
1- DMVs : select * from $system.discover_traces
2-Discover Commands:
<!--By Default you will get trace for Flight Recorder-->
<!--This script will give you a list off all running traces-->
<Discover xmlns="urn:schemas-microsoft-com:xml-analysis">
<RequestType>DISCOVER_TRACES</RequestType>
<Restrictions>
<RestrictionList>
</RestrictionList>
</Restrictions>
<Properties>
<PropertyList>
</PropertyList>
</Properties>
</Discover>
-Now ,we created trace and monitor. Now it is time to stop our server side trace.
Following Script stops Profiler Trace
<!--How to Drop the Trace which you had created-->
<Delete xmlns="https://schemas.microsoft.com/analysisservices/2003/engine" xmlns:soap="https://schemas.xmlsoap.org/soap/envelope/">
<Object>
<TraceID>DBA Performance Trace</TraceID>
</Object>
</Delete>
if we look at running traces on server again, we will see that our server side trace is stopped now. You can go to path and review your trace file. Only trace you will see running is Flight Recorder for Analysis Services.
You can also create SQL Server Agent job and add Job Step which executes XMLA Command to manage server side trace. I have seen some customers creating these jobs to manager server side tracing for Analysis Services.
If you have any questions feel free to contact me
Thanks
Kagan Arca


