Serverless Azure Architecture pt III, Realtime Power Bi Dashboards for Free !
This is Part III of articles in series discussing Azure Functions, a serverless way to execute custom logic on Azure.
Part I - Simple Forms Part II - Adding Authentication Part III - Power Bi Dashboarding
So You've seen cool Power Bi Dashboards and would like to deliver something similar to Your 50 000 users ?
Luckily You can, and in some cases You can do it for free ...
Power Bi Dashboards with Azure Functions
There are basically 4 ways to integrate your own software with Power Bi.
1. Power BI Embedded
This is basically embedding an iframe to Your own page. Users do not need to have licenses but the App need to purchase renders. App creates app tokens and attaches them to iframe requests to prove the license.
Very good for delivering full blown dashboards with drill-in capabilities.
Read more.
2. Using Publish To Web
You can publish a report in Power BI by choosing File/Publish TO Web. You will get embed code for an iframe that does not require user licenses, but BEWARE , anyone can see this if they know the address.
Good for more general reports, like publishing some public domain data in blogs and such.
Read more.
3. Using Power BI Rest Api's to push data into Power BI
In this option we are creating a virtual database table inside Power BI and pushing in rows with your own code. You can try this live with our nice apiary page: try it Read more.
4. Using Power Bi Visuals javascript library
So this is what our little article is actually about today.
We are including the Power BI visuals javascript - framework and using it directly to visualize some of our own data on a web page.
The possibilities are endless since we are free to get the data from where ever we see fit and have Power BI components visualize the dashboard with refresh rates that we are able to fully control (compare to Power Bi fed by Azure Stream analytics where you get refresh rates something between 2 - 10 seconds, randomly).
In this example I am using Azure Functions as a very flexible source of data. With few lines of scripting we can get our hands on blobs, tables, queues ... what have You.
To actually get the needed javascript library ,go here and download it :
https://github.com/Microsoft/PowerBI-Visuals/
To use the library You do pretty much what You expect to do with this kind of libraries. Get some data, format it the way the library can consume it, point out the div that the library can use to create the canvas on and ... that's it really.
Let's take a quick look at some important pieces of code:
This is javascript function on my html-page doing the necessary setup :
function createVisual () {
var pluginService = powerbi.visuals.visualPluginFactory.create ();
var defaultVisualHostServices = powerbi.visuals.defaultVisualHostServices ;
var element = $ ( '.visual' );
element.height ( height ). width ( width );
// Get a plugin
visual = pluginService.getPlugin ( 'barChart' ). create ();
powerbi.visuals.DefaultVisualHostServices.initialize (); visual.init ({
// empty DOM element the visual should attach to.
element : element ,
// host services
host : defaultVisualHostServices ,
style : createDefaultStyles (),
viewport : {
height : height ,
width : width
},
settings : { slicingEnabled : true },
interactivity : { isInteractiveLegend : false , selection : false },
animation : { transitionImmediate : true }
});
updateVisual ();
}
In addition to this I have a timer that calls updateVisuals every few seconds which in turn uses ajax call to talk to our backend function supplying new data.
setInterval ( function (){
getData (); }, 3000 );
function getData () {
$ . ajax ({
url : '/api/MyDashingBoard?code=MYCODE' ,
type : 'GET' ,
contentType : 'application/json' ,
dataType : 'json' ,
success : function ( data , text ) {
updateVisual ( data.l1 , data.l2 );
},
error : function ( request , status , error ) {
$ ( "#errormsg" ). html ( request.responseText );
$ ( "#failureinfo" ). removeClass ( "hidden" );
console.log ( request.responseText );
}
}); }
And this code results to something like this on my dashboard:
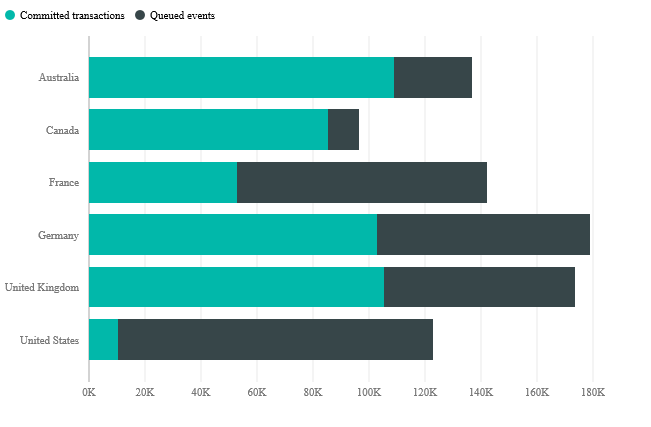
Pretty neat , huh ?
Get the bits:
You've probably noticed that I have used the location from Part I of this series for storing my static files.
In order to access those files You would have to fix the urls in html-files to reference your service instead of mine and change the ajax function to point to your newly created Azure Function located inside pt3function.html (add it to the same Function App as previous parts).
You would request the test page from the Part I fileservices with something like this:
https://petsaforms.azurewebsites.net/api/YOURPT1NAME?code=YOURPT1CODE\&op=file\&p1=forms/test.html