HOWTO: Show actuals from the past while forecasting for the future
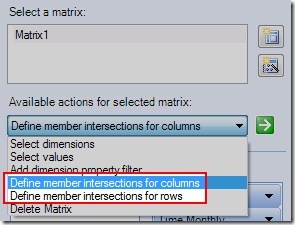
Also phrased: How can I create an "asymmetric crossjoin" without using custom MDX? MDX experts will probably recognize this issue right away and understand how to build a matrix from scratch for this. But not everybody recognizes that the add-in has specific support for this scenario. It's called "defining member intersections" and it can be done for both rows and columns. To activate the feature select your matrix in the action pane and choose the appropriate item in the available action drop down then click the green go button:
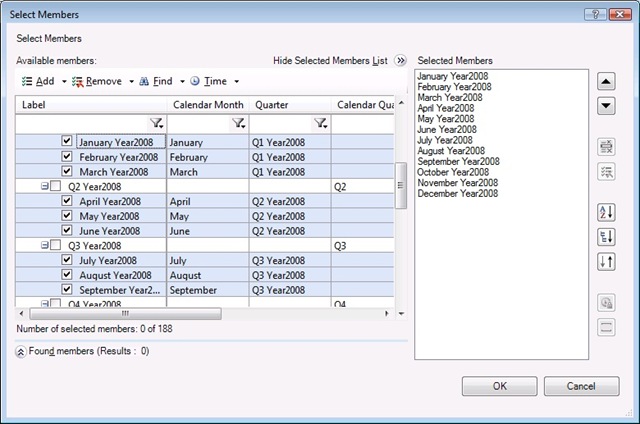
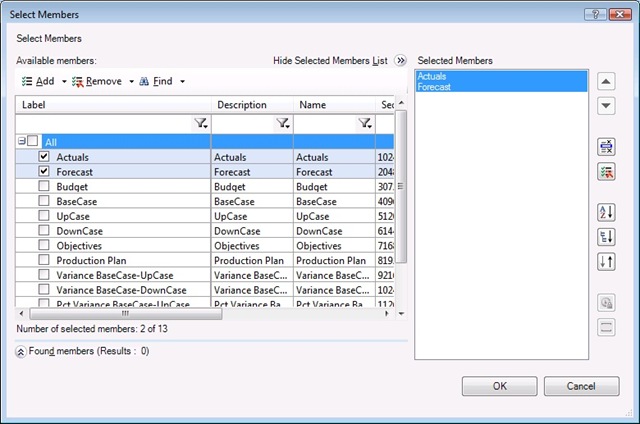
Anyway to use it we need a matrix. So to start with lets create a typical matrix with Account on rows and Scenario/Time on columns. I'm going to pick Actuals and Forecast for Scenario, and then all the months for 2008:
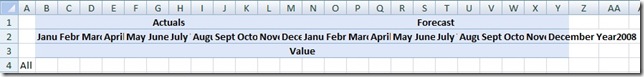
By default the add-in is doing a "symmetric crossjoin" and rendering too much data for our goal (I had to shrink the column width just to be able to get the image down to a reasonable size but clearly show Actuals and Forecast plus all 12 months duplicated. Obviously at this point we could simply hide rows and columns using Excel functionality but for a large matrix this is going to pull down a lot of extra data that we don't really need for this scenario. So let's go ahead and see what happens when we define member intersections for columns with the matrix so far:

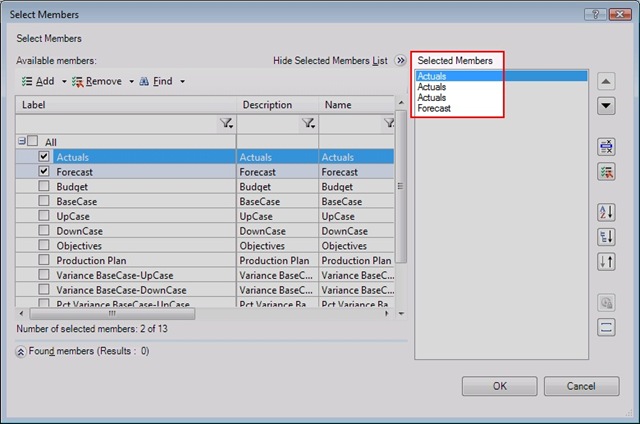
Let me draw your attention to the rendering options images along the bottom of the dialog. They are meant to visually hint the difference between rendering all intersections and one by one. So now I switch to column by column. Now as the picture indicates I have to match each member in the Scenario column with the appropriate member in the Time column. To do this I click the appropriate "Edit..." area to invoke the member picker where I duplicate the selection (just click add extra times while highlighting actual. Then make sure the order is 3 Actual's followed by Forecast. Here is what Actuals looks like duplicated 3 times in the member picker:
Intuitively you might think I now have to duplicate Forecast 8 times for the remaining 9 months, but there is a special case for this: The last member in any dimension will automatically be applied/duplicated to match the other columns. So my final define intersections choices look like this:
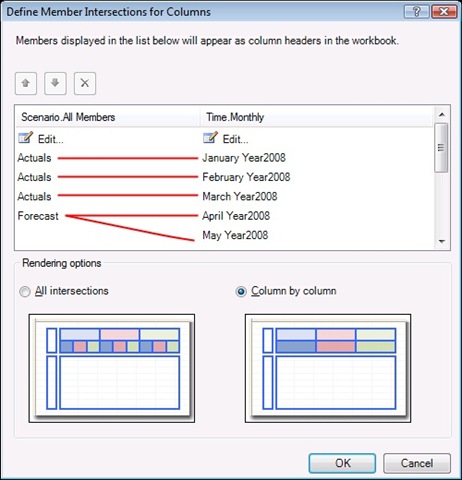
(Those red lines I added just to be explict about where the "intersections" are) And the matrix renders like this:
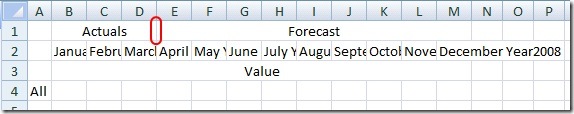
(I added the red oval and removed the matrix style so it was easier to see the dividing line between Actuals and Forecast. Typically when we are showing data rather than blank and have a writable region this is much more clear...)
This technique works for more than 2 dimensions. Although I'll be one of the first to admit that while duplicating your selections can be a little tedious sometimes, defining intersections is a very powerful feature. I personally haven't seen a lot of OLAP front-ends that allow this. One popular alternative seems to be to start with everything and then cut out the intersections that you don't like. That frequently reverts the design to static selections which isn't necessarily as convenient. What I've shown so far is also static selection since we had to do some duplication and picked each month individually. That actually made this process more tedious than necessary... Let's go back to how I selected the time members originally:
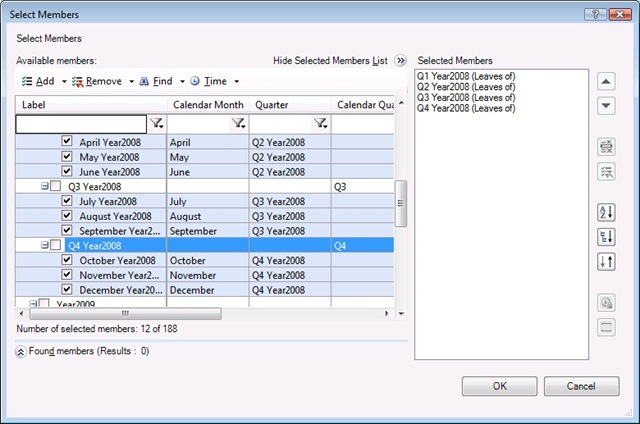
I this case I know I want the first calendar quarter to be used for Actuals and the rest of the year for Forecast. So let's define that using some sets. I'll pick lowest of Q1, then lowest of Q2, Q3 and Q4:
Those more familiar with OLAP might notice that there are many more ways to have expressed this set...that's a topic for another post. For now I'll just point out that if you can describe your set carefully then the tedious part of duplicating selections for column by column or row by row becomes unnecessary. There's even clever ways to describe the set as "from the beginning of the year until now" or "from now until the end of the year"...but that is also a topic for another post.
So I'll leave you today with some final images. First you can see there was no need to duplicate Actuals after using a set for the first part. And since the last selection gets repeated as many times as necessary I also didn't have to duplicate Forecast. I really encourage you to explore the member picker to become familiar with the kinds of expressions and sets possible. It can really make your authoring life that much easier. My goal is to help PPS report/form authors avoid learning MDX for as long as possible! (The matrix image is the same as the first asymmetric image, I'll leave it as an exercise for the reader to confirm I didn't cheat when I reused the same image)

The process is the same for rows, with just "column" in the UI replaced by "row". So I won't go through that specifically. From what I've seen the most common question around this involves Time and Scenario - especially for data-entry form templates.