PerformancePoint Data Connection Libraries and Content Lists in SharePoint
All the items you create when you build BI solutions using PerformancePoint are stored in SharePoint. PerformancePoint data sources are stored in specialized SharePoint document libraries. PerformancePoint content is stored in specialized SharePoint lists; all the scorecards, KPIs, indicators, reports, filters, and dashboards that are created as part of a PerformancePoint solution are stored in SharePoint lists.
Explore In SharePoint with BI Center
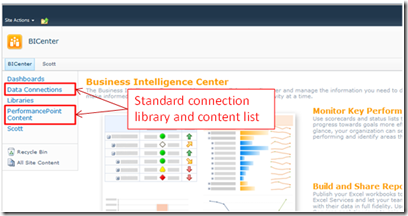
You can explore this by creating a new site using the BI Center template (for instructions on how to do this see Getting Started: Introduction to the Business Intelligence Center). New BI Center sites contains a library called "Data Connections" and a list called "PerformancePoint Content". Links to the site's data connection library and content list are available in the quick launch area as shown in the following image:
The library "Data Connection" is the default location for storing PerformancePoint data sources and the list "PerformancePoint Content" is the default location for storing PerformancePoint reports, scorecards, filters, dashboard layouts, etc.
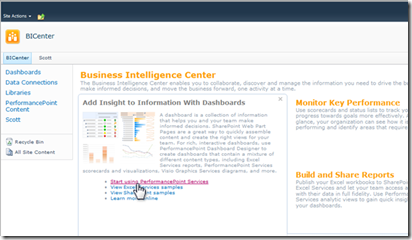
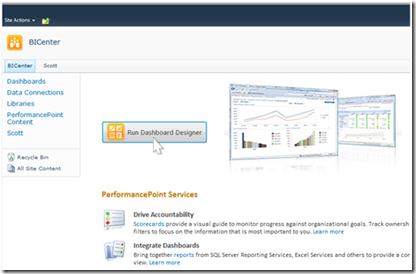
When you start the PerformancePoint Dashboard Designer (for more information on Dashboard Designer, see Getting Started: PerformancePoint Dashboard Designer) from the link your BI Center site as shown in the following images, it will connect to these locations and allow you to create and edit data sources and the content items that make up a PerformancePoint dashboard:
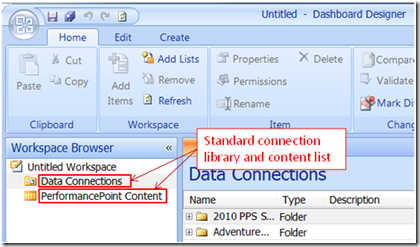
In the Designer, you can see the data source libraries and content lists you are using. For example, this is what you'll see when you launch the Designer from a BI Center site:
You can create additional data source libraries and contents lists in you BI center site to store your data sources and dashboard designs. You can use multiple data source libraries and content lists to partition the assets that make up your solutions so they can be secured appropriately and so they can be organized based on organizational areas, solution type, etc.
Use PerformancePoint in any non-BI Center Site
PerformancePoint can also be used without creating a BI Center site. PerformancePoint data source libraries and content lists can be created on any site where PerformancePoint is available. These libraries and lists provide you with direct access to the SharePoint Designer to create and edit data source, reports, scorecards, etc.
To create a new data source from a PerformancePoint data connection library:
- Open the data connection library
- Select the "Documents" in the library's tool bar
- Select "New Document"
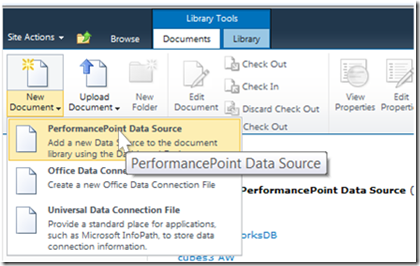
- Select "PerformancePoint Data Source" from the resulting menu (see the following image). The PerformancePoint Dashboard Designer will be started and a new data source will be created.
To create a new report, filter, scorecard, etc. from a PerformancePoint content list:
- Open the content list
- Select the "Items" in the list's tool bar
- Select "New Items"
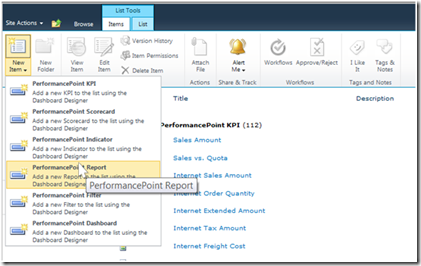
- Choose the type of item you would like to create (see the following image). Again, the PerformancePoint Dashboard Designer will be started and an item of the selected type will be created.
PerformancePoint data source, reports, scorecard, etc. can be edited directly from the SharePoint library or list that contain them. To do this:
- Select the data source or content list item in the list or library.
- Open the item's context menu
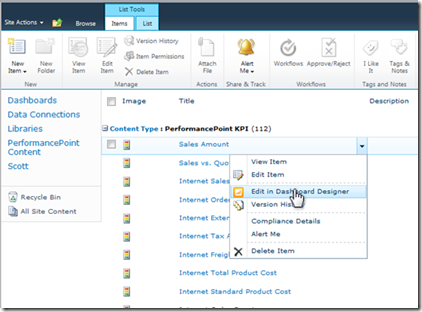
- Select the operation "Edit in Dashboard Designer".
The following image show a PerformancePoint content list item and its context menu:
Preview PerformancePoint Reports and Scorecards in SharePoint
Finally, you can view reports and scorecards from the SharePoint content lists that contain them without starting the designer and without placing them in a dashboard. Here's the process:
- Select the report or scorecard you'd like view in the PerformancePoint content list.
- Open the report or scorecard's context menu.
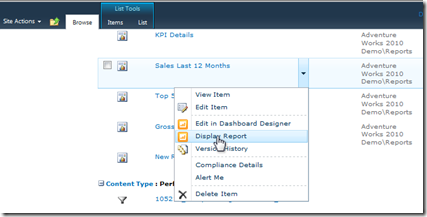
- Select the operation "Display Report" or "Display Scorecard".
The following images illustrate this. Select "Display Report" from the reports context menu in the content list:
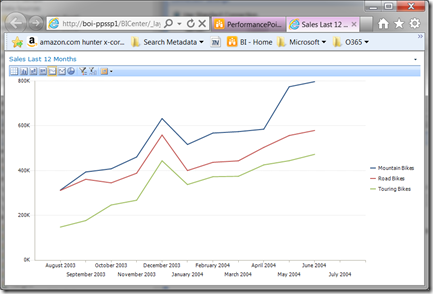
Then the report will be displayed in a new tab in your browser:
Dave Sherman
Program Manager, Office BI
