Using Project Server 2010 with PerformancePoint Services
Today’s post is by Denise Stendera, a writer on the SharePoint business intelligence team. Thanks Denise!
Got Project? When you create a Project Web App in SharePoint Server, you automatically get a Business Intelligence Center. If PerformancePoint Services is configured, you can use Dashboard Designer to create project management dashboards.
For example, you can create a dashboard to track project resource usage like the one shown in the following image:
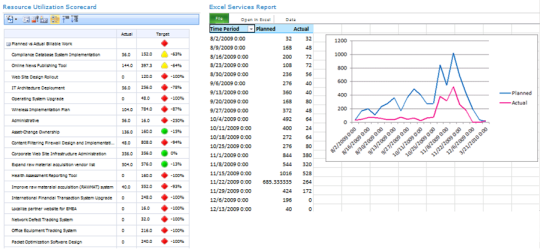
Using the dashboard filter, users can select one or more projects for which they want to view performance. The scorecard then updates to display information for the items that are selected in the filter. For example, if a user selects two items in the filter, the scorecard displays information for only those items. Similarly, if users select all the items in the filter, the scorecard displays information for all the projects.
Curious about how to create a dashboard like this for your organization?
Here’s how we did it, in three steps:
- We began by installing and configuring Project Server 2010 as described in Deploy Project Server 2010 to a server farm environment. As part of that process, we created a Project Web App (PWA) site and configured reporting for Project Server.
- We then configured PerformancePoint Services to work in our environment, as described in Use Project Server with PerformancePoint Services.
- Using sample data from the downloadable Microsoft Project 2010 Demonstration and Evaluation Installation Pack, we used Excel Services together with PerformancePoint Services to create our dashboard. (Detailed steps are included in Track project resource usage by using a dashboard.)
- Using Excel, we created, configured, and published a workbook to SharePoint Server. The workbook uses an external data connection to Project Server timesheet data. It contains a PivotTable report and a PivotChart report comparing planned hours to actual hours by time period and by project.
- Using Dashboard Designer, we created a SQL Server Table data connection.
- Using the SQL Server Table data connection in Dashboard Designer, we created a scorecard. The scorecard contains a key performance indicator (KPI) that uses calculated metrics.
- Using the same data connection in Dashboard Designer, we created a dashboard filter.
- Using Dashboard Designer, we created an Excel Services report to display the PivotTable report and the PivotChart report we created earlier.
- Using Dashboard Designer, we created a dashboard page and added the scorecard, Excel Services report, and filter to the page. We connected the filter to the scorecard and then published the dashboard to SharePoint Server.
It’s that easy!
Be sure to see all the details in Track project resource usage by using a dashboard. And, take a look at our other business intelligence solutions and scenarios on TechNet.
Happy Dashboarding!
Denise Stendera
P.S. We’re always interested in your feedback and suggestions. Please use comments to tell us what you think and what you’d like to see. You can also send us an email at mailto:docbi@microsoft.com.