How to integrate SSRS Reports with Dashboard Filters
PerformancePoint Monitoring Filters work with SSRS reports, both relational and OLAP. To configure a dashboard pages to use common filters to drive SSRS reports and other PerformancePoint views, follow the below steps.
For this example, we will configure a dashboard containing one page with one scorecard view (OLAP data source) and one SSRS Relational report and a second page containing the same OLAP scorecard and a second SSRS OLAP report. Note, the SSRS reports are both configured in SSRS to have an SSRS parameter based on Geography - the parameters must be set up in SSRS prior to connecting the parameter to a Filter in the PerformancePoint dashboard.
Create report views for your SSRS reports
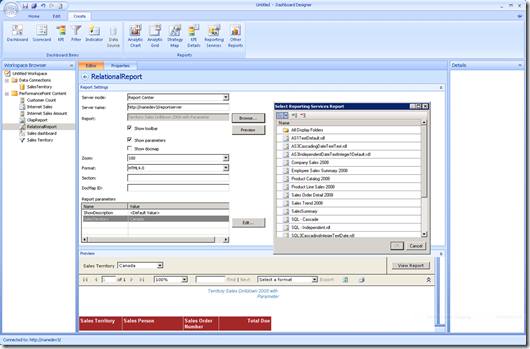
Right click the PerformancePoint Content list in the dashboard designer and select New->Report. From the dialog select Reporting Services and click OK. You can also create the report view by clicking on Reporting Services on the Create tab of the Ribbon .
Change the name of the created view and hit Enter.
Enter the Server URL to the SSRS report server. EX: https://servername/reportserver.
Click the Browse button and select the SSRS report you wish to include. Click OK.
Ensure that the parameters came through and are listed in the Report Parameters section.
Select each parameter, click Edit and set a default value.
Save the report to your PerformancePoint Server by selecting the Save button on the Quick Access Toolbar.
Repeat steps 1 through 8 for all your report views you wish to include. Note that the process does not differ for Relational vs. OLAP SSRS Reports.
Configure your dashboard
Click on Dashboard button on the Create tab of the Ribbon in the Dashboard Designer to create new dashboard.
Select your template (in this example, we will choose 3 Rows) and click OK.
Change the name of your dashboard in the Workspace Browser.
Drag your scorecard, in this example I choose an OLAP scorecard, and pull it into the Center Row.
Drag your SSRS report, in this example I pull an SSRS Relational Report, into the Bottom Row.
Create a Filter in the Dashboard. In this example, I build a filter off of my OLAP data source that sources my scorecard and is the same cube as my SSRS OLAP report is built from.
Drag your Filter into the Top Row.
Click on the Filter in the top row you will see a list of options listed under your parameter name as shown below:
Select Display Value and drag it to your SSRS Relational Report input area in the Bottom Row. Note, in order for this to work, your names in your SSRS Relational Report parameter, must match the captions of your members in the cube. Display Value specifies that we will provide the cube member name caption as the input to the report.
In the Connection dialog, select the SSRS Report parameter from the Connect to: drop down to create the link between the PerformancePoint filter and SSRS report parameter. Click OK.
Click on the filter again and select MemberUniqueName and drag it into the input area for the scorecard. We do this because our scorecard is built off of a cube data source and needs the MDX member unique names passed as inputs.
In the Connection dialog, select Page form the Connect to: drop down list to pass the parameter as a filter to the scorecard. Click OK.
Create a second page in your dashboard, also configured with 3 rows.
Place your same OLAP scorecard in the Center Row, your SSRS OLAP report in the Bottom Row and the same filter in the Top Row.
Click on the filter and drag the MemberUniqueName property to the input of the SSRS OLAP Report. In this case, we need the member unique name because the SSRS report is an MDX query which requires the MDX unique name as the parameter value.
In the Connection dialog, select the SSRS Report parameter from the Connect to: drop down to create the link between the PerformancePoint filter and SSRS report parameter. Click OK.
Click on the filter again and select MemberUniqueName and drag it into the input area for the scorecard.
In the Connection dialog, select Page form the Connect to: to pass the parameter as a filter to the scorecard. Click OK.
Publish your dashboard by selecting the Deploy from the File Button.
In the Deploy To dialog select the Document Library you wish to publish to, select the master page you wish to publish with and click OK.
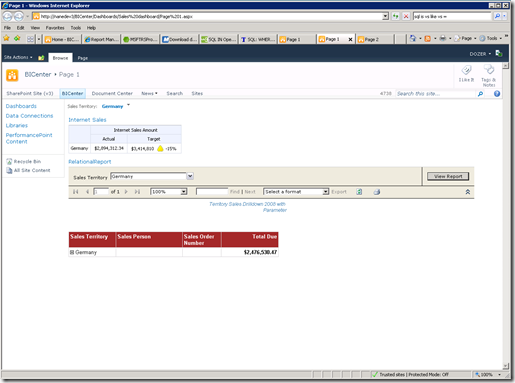
Your exported dashboard should look as follows:


