Modifying PPS Dashboards with SharePoint Web Parts
In a session I gave at TechReady 10, I talked about the difference between dashboards and dashboard definitions. In the session, I made a point to talk about the difference between dashboards and dashboard definitions. Dashboard definitions are the ddwx files that you’re used to working with when you use dashboard designer. In PerformancePoint 2007, these were the bswx files. The extension is different in PerformancePoint 2010 because they are very different files, but their core function is the same – to define your dashboard, how it lays out in a web part page, what the data sources connect to, the location of each dashboard object, as well as other things. In 2007, we stored all of our content in a PerformancePoint-specific database. In 2010, we moved away from a database storage model in favor of SharePoint lists and libraries. So, that ddwx file defines where objects lie within those SharePoint lists and libraries. When you export from dashboard designer to a SharePoint list, your resulting aspx page becomes stored in a document library. At that point, your exported aspx file and your ddwx dashboard definition are two very different things. And each time you deploy your dashboard definition to SharePoint, you overwrite your previous aspx file. Therein lies the problem with modifying your aspx files with SharePoint web parts.
I wanted to show you that you that it is possible to modify your dashboards with SharePoint web parts and still change your dashboard definitions. Because PerformancePoint in 2010 is part of the SharePoint infrastructure, you can share dashboard web parts across sites. This allows us to create a dashboard from within SharePoint using PerformancePoint objects that have already been published to SharePoint lists.
What I want to show you is how to publish a dashboard to a SharePoint staging site that you can use as a model for a dashboard that you can create manually within SharePoint itself. This allows you to publish your dashboard definition as many times as you’d like to your staging site and never alter the aspx page that you make in your “final” site.
Publish Your Dashboard from Dashboard Designer
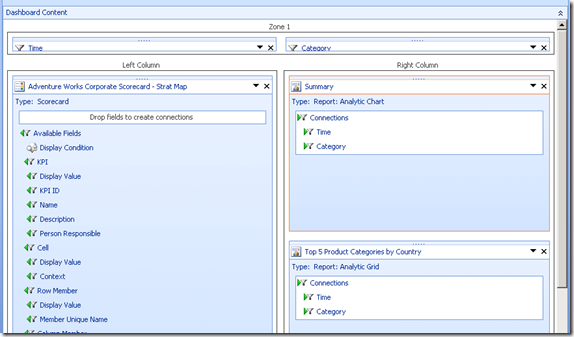
Once you create your dashboard in designer, you can publish your completed dashboard to your SharePoint Dashboards library. When you do, all of your dashboard objects are essentially placed within the SharePoint web part gallery to be used in any way that you want. Put another way, PerformancePoint web parts that have yet to be associated with a list item are sitting in the gallery, waiting to be hooked up to your published dashboard object. I’ll show you what I mean below. As a model, I created a simple dashboard in dashboard designer. It contains a scorecard, a chart, and a grid. Here is an image of it in designer:
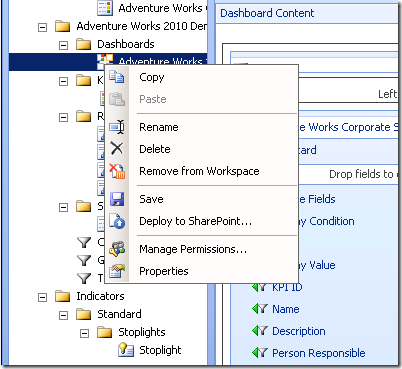
Then I can publish this dashboard out to my SharePoint site using the Deploy to SharePoint option available in dashboard designer.
Create an Empty SharePoint Web Part Page and Build Your Dashboard
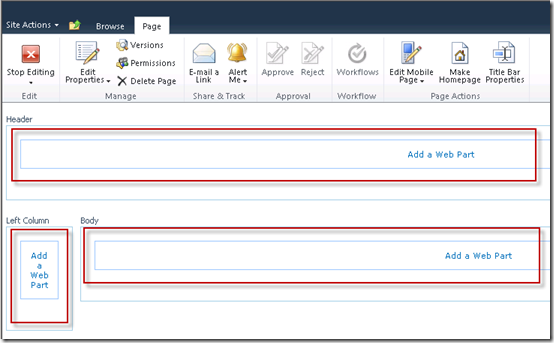
Now I have a complete dashboard published to SharePoint. My dashboard and data sources are in libraries, and my content is in a list. I’ve created an empty web part page, which gives me plenty of layout options.
I like the two-column layout because I can put my scorecard on the left and my chart and grid stacked on the right. I created it inside of a BI Center site and put it in the Dashboards library that’s created with every BI Center site.
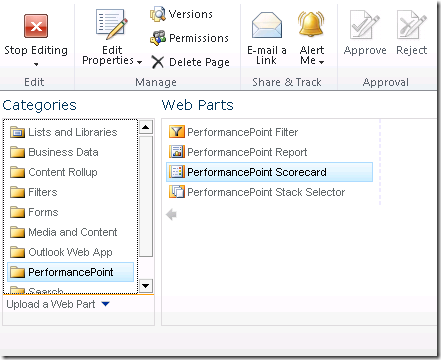
As part of installing SharePoint enterprise, I get a list of PPS web parts. I can drag one onto my web part page and then connect it to a corresponding, published PPS object from a list. In other words, I select an empty scorecard web part and point it at my published scorecard. I place my new scorecard in the Left Column zone.
Notice from the image above that if you have a bunch of objects that have been published from dashboard designer, it’s easier to find the right object if you collapse the groups that you don’t need. Once the reference loads into the location box, close the web part properties pane, and your scorecard should appear in the Left Column zone.
Once the scorecard is there, I follow the same process for my chart and grid. I put each of those in the Body zone of the web part page. When you select a PPS object template, make sure that you choose one that corresponds to the kind of list item to which you’re going to connect. In this case, since I’m adding a chart and a grid, I use the PerformancePoint Report object.
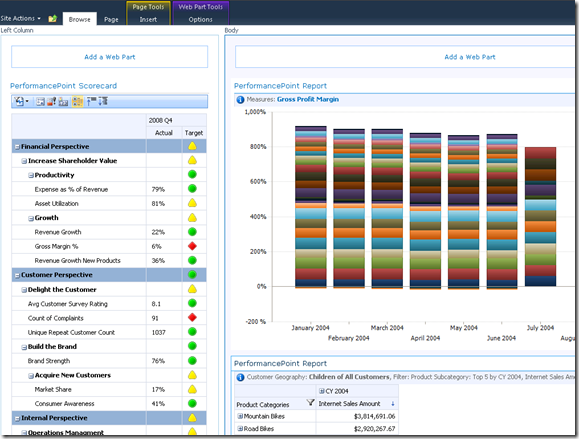
Once the web part page contains its basic objects, it should look something like the the screen shot below.
Connect the Filters
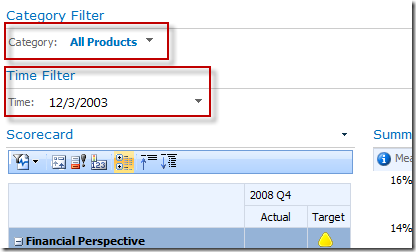
But the PPS web parts alone don’t really replicate what we had in dashboard designer. We still need the filter functionality that makes the dashboard meaningful. Your filters are also objects that can be hooked up the same way that your scorecards, grids, and charts were. I have a Header zone at the top of the page. I’m using that to hold my filters. Use the same process to add whatever filters you had on your dashboard designer dashboard. I have a time filter and a category filter.
Now that we have filters on the page, we need to connect them to our existing web parts. You can only expose the SharePoint connection framework if you are in the page’s edit mode. So, since you’ve just added filters, go ahead and keep the page in edit mode. Before you hook up the filters, it’s best to name your web parts using the web part properties pane. This makes it much easier to make your connections because you can connect them according to a meaningful name, and not just a generic name like “PerformancePoint Web Part [1].” When you have several web parts that take connections, you don’t know which web part is the correct one when their names contain generic separators like [1] and [2].
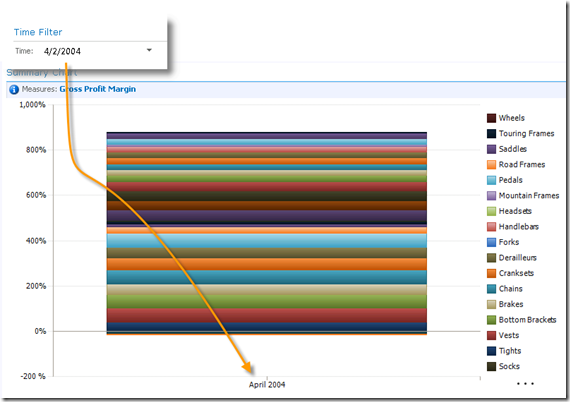
The first filter that I hook up is the time filter; I hook it to the chart web part (the Summary Chart). The chart is capable of filtering by time not only because its x-axis includes months. Here, I’m sending values to the summary chart, so I need to choose the PerformancePoint Values option (below I explain why this option is important).
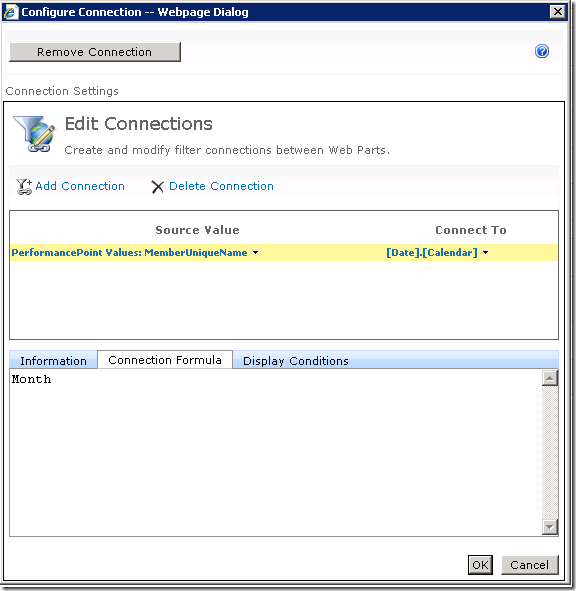
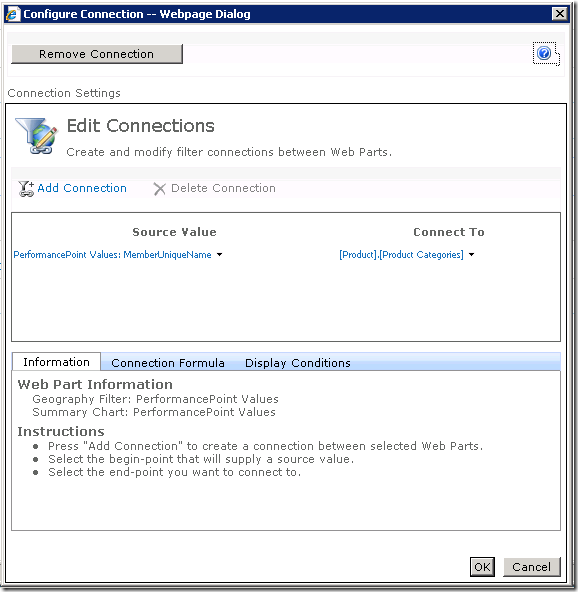
You may have to play a little bit with the different connection possibilities because they are not always intuitive. In this case, I want my source value to map to my MemberUniqueName, and I want to connect to the [Date.Calendar] dimension. I also want to add a connection formula so that my time intelligence calendar, which includes day, month, and year, only passes the month value to my Summary Chart – since my chart really only cares about month and year.
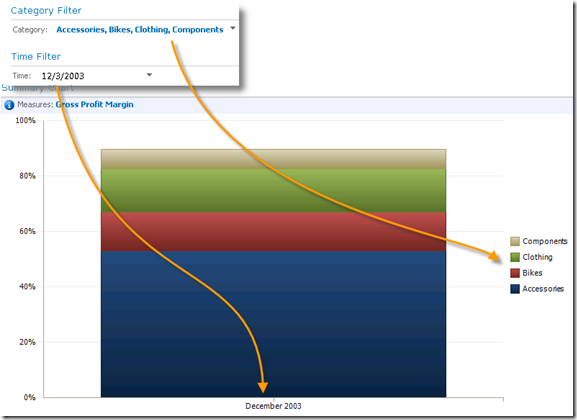
I also need to filter all of the categories in the chart and yet keep my time filter by month. Looking at a stacked chart with nearly 20 categories isn’t very useful. Fortunately, SharePoint filters allow for multiple connections to the same web part, so I can have a chart filtered by both category and time. Note: This is why it’s important to use the PerformancePoint Values option: if you want to take advantage of the 2010 filter features, it’s important to use the “Get PerformancePoint Values From” filter and not to use the “Get Filter Values From” when setting up your web part to receive filter values. The “Get Filter Values From” option is part of the 2007 SharePoint filter framework, and there is no good way, from a programmatic standpoint, to hide that filter type from the connection menu when dealing with just PPS web parts. Plus, the “Get PerformancePoint Values” adds some nice features to the web part connection. With that connection type, you can employ post formulas (like we did with the calendar filter), conditional visibility, and AJAX value changes (which will keep your entire page from posting back, or refreshing, when you change values). You can certainly use the “Get Filter Values From”, but you will leave some nice functionality on the table, and your dashboard won’t behave as it would have had you created the same thing using dashboard designer.
Again, I will send my PerformancePoint values to my Summary Chart. This time, there is no connection formula to worry about, so I will simply plug in my “Source Value” and “Connect To” values with MemberUniqueName and Product Categories respectively.
This gives me a chart filtered by both time and category. Notice how much simpler this one is than the prior screenshot that wasn’t filtered by category.
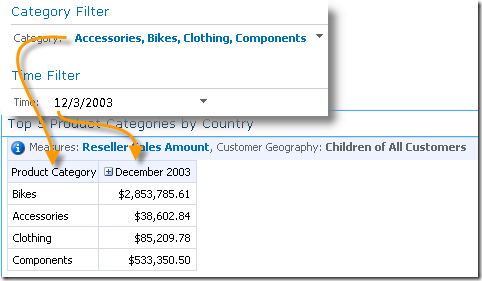
Of course, I can do the exact same thing for the “Top 5 Product Categories by Grid” so that both my chart and my grid are filtered by the same values.
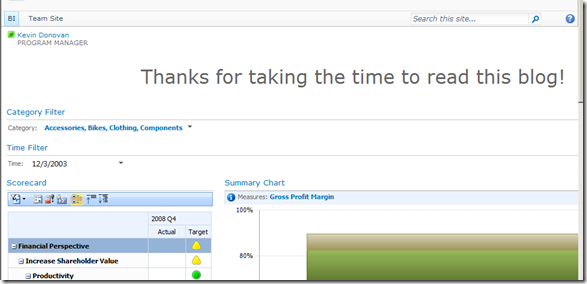
So, that’s all there is to it. Of course, you can do much more than I demonstrated here. There are some pieces that I didn’t show, like conditional visibility or filtering the scorecard, simply because once you get the basic idea, you can create any dashboard that meets your needs. And now that I’ve created my dashboard using web parts from SharePoint, I can add as many non-PerformancePoint web parts as I need. You can see below that I added a content editor web part with a thank you message as well as a simple presence web part, which can be used, perhaps, as a way to identify who’s responsible for a full dashboard page. The combination of PerformancePoint and SharePoint web parts can make for a truly powerful and interactive page.
Summary
The point of this exercise is to be able to create a PerformancePoint dashboard using only SharePoint tools. I suggested first publishing your dashboard to a staging site using dashboard designer. And that’s only because you then have a model to which you can refer when wiring up your “handmade” dashboard. That’s especially useful when creating those filter connections. However, you certainly don’t have to publish your dashboard from designer. You can simply save your PPS objects to lists and libraries and then undertake your build experience from SharePoint. And since your objects refer to data source meta data in libraries, those web parts will stay connected to your changing back end data sources.
Kevin Donovan, Program Manager
SharePoint BI
